Trade plan used: Buy a small staged long in BTC or IBIT (spot first; no leverage unless portfolio regime is already risk-on).
What trade: Buy a small staged long in BTC or IBIT (spot first; no leverage unless portfolio regime is already risk-on).
When to put it on: On/after the weekly close that printed the MACD bullish cross (2026-07-26). Best if price is reclaiming or holding above the 20-week EMA; if still below a falling 20W EMA, wait for a weekly close back above it before sizing up.
Entry instructions: ENTRY: buy near $65,340 on/after 2026-07-26 using a weekly close confirmation for the pattern. Do not market-chase far above entry without a plan; if price is already >3–4% through entry, wait for a hold/retest.
Exit instructions: EXIT WIN: scale out into $71,874 (first tranche at target; trail remainder above rising 20W EMA if trend continues). EXIT LOSS: flatten or cut adds on a weekly close under invalidation $60,113. TIME EXIT: if neither target nor stop by ~13 weeks, reassess — reduce if structure weakens.
When to add: Add only on a green weekly close that keeps MACD above signal, or on a shallow retest that holds the 20W EMA.
Risk / targets: Hard invalidation / exit: weekly close below $60,113 (-8.0% from entry). First take-profit / reduce zone: $71,874 (+10.0% from entry, ~1.3R). Horizon ~13 weeks unless stopped/target hit sooner.
Size: Size: starter 25–40% of intended BTC sleeve add; leave room to add once. Prefer spot/IBIT. Options/leverage only if portfolio regime already allows heavier risk/calls.
Action: HISTORICAL PLAN (not a live order): on 2026-07-26 the play was buy near $65,340, invalidation $60,113, target/exit $71,874. Outcome: WIN.
If it fails: At the time, a weekly close under $60,113 meant exit/no add.
Setup: Weekly MACD bullish cross triggered 2026-07-26. Thesis: Weekly MACD line is -5400 vs signal -5591; histogram 191. Trade plan used: Buy a small staged long in BTC or IBIT (spot first; no leverage unless portfolio regime is already risk-on). Entry instructions: ENTRY: buy near $65,340 on/after 2026-07-26 using a weekly close confirmation for the pattern. Do not market-chase far above entry without a plan; if price is already >3–4% through entry, wait for a hold/retest. Exit instructions: EXIT WIN: scale out into $71,874 (first tranche at target; trail remainder above rising 20W EMA if trend continues). EXIT LOSS: flatten or cut adds on a weekly close under invalidation $60,113. TIME EXIT: if neither target nor stop by ~13 weeks, reassess — reduce if structure weakens. When to put it on: On/after the weekly close that printed the MACD bullish cross (2026-07-26). Best if price is reclaiming or holding above the 20-week EMA; if still below a falling 20W EMA, wait for a weekly close back above it before sizing up. When to add: Add only on a green weekly close that keeps MACD above signal, or on a shallow retest that holds the 20W EMA. Size: Size: starter 25–40% of intended BTC sleeve add; leave room to add once. Prefer spot/IBIT. Options/leverage only if portfolio regime already allows heavier risk/calls. Risk math: entry $65,340 · invalidation $60,113 (-8.0%) · first target/exit $71,874 (+10.0%) · reward/risk 1.3R. Invalidation text: MACD line rolls back below signal on weekly close or histogram flips materially negative. Action: HISTORICAL PLAN (not a live order): on 2026-07-26 the play was buy near $65,340, invalidation $60,113, target/exit $71,874. Outcome: WIN. Resolved outcome: WIN on 2026-08-23 @ $71,874 (+10.0%) — target hit
CALLS_ALLOWED_IF_SETUP_VALID — Regime UPTREND_MODE allows selective/allowed calls. Only buy if Protocol BTC setup still valid and you already have/plan core IBIT or spot. Prefer the PRIMARY debit spread; confirm live bid/ask and open interest before sending.
IBIT call watchlist (date + strike)
Rank / structure
Expiration
Long strike
Short strike
Why
PRIMARY
Call debit spread (preferred)
2026-10-16 (47d)
$46
$49
Buy IBIT 46 call / sell 49 call. Long near entry/momentum; short near Protocol BTC target zone (~IBIT $41). Defined risk; multi-week DTE fits weekly TA better than weeklies.
CONVEX SATELLITE
Long call only (smaller size)
2026-10-16 (47d)
$46
—
Buy IBIT 46 call only for extra upside past target; full premium at risk. Size smaller than spread.
ALTERNATE
Call debit spread (preferred)
2026-12-18 (110d)
$44
$48
Buy IBIT 44 call / sell 48 call. Long near entry/momentum; short near Protocol BTC target zone (~IBIT $41). Defined risk; multi-week DTE fits weekly TA better than weeklies.
CONVEX SATELLITE
Long call only (smaller size)
2026-12-18 (110d)
$46
—
Buy IBIT 46 call only for extra upside past target; full premium at risk. Size smaller than spread.
LONGER-DATED
Call debit spread
2027-02-19 (173d)
$44
$48
Buy IBIT 44 / sell 48 with extra time for slow repair/breakout; only if core IBIT/spot already on.
Strikes are chosen from Protocol BTC entry/target mapping + IBIT spot; verify the exact listed strike on your broker. · Avoid 0–14 DTE weeklies for this system. · Premiums not auto-filled when options chain API is unavailable — check live NBBO. · Research only · not investment advice.
Win rate
65%
closed weekly triggers
Avg return
+3.0%
closed outcomes
Triggers
62
rising-edge historical + live
Wins / Losses
40 / 22
0 open
Horizon
13w
target 10% / stop 8% default
Latest live
0
active pattern(s) now
Live action · what to do now
No live open pattern right now. Wait for the next weekly trigger.
Pattern accuracy board
Pattern + plain-English playbook
Triggers
Wins
Losses
Open
Win rate
Avg ret
Ascending triangle
Wait for weekly close above flat resistance; buy breakout/retest; stop back under the line.
11
7
4
0
64%
-2.3%
Cup and handle
Wait for weekly close above cup pivot; small size until hold; stop under handle low.
6
5
1
0
83%
+7.8%
20-week EMA pullback in an uptrend
Buy pullbacks to the 20-week EMA only while uptrend filter is on; stop on weekly close through EMA/swing low.
23
12
11
0
52%
+3.0%
Inverse head & shoulders
Buy weekly close above neckline; add on held retest; stop under right shoulder.
5
4
1
0
80%
+7.9%
Weekly bull flag
Wait for weekly close above flag high; buy breakout/retest; stop under flag low.
4
3
1
0
75%
-0.4%
Weekly MACD bullish cross
Buy staged long after weekly MACD cross up; best above rising 20W EMA; stop on MACD failure or weekly EMA loss.
13
9
4
0
69%
+4.5%
Rising-edge weekly detector · stop priority if same bar · else target · else 13w time-stop by sign of return
Trade plan used: Buy a small staged long in BTC or IBIT (spot first; no leverage unless portfolio regime is already risk-on).
What trade: Buy a small staged long in BTC or IBIT (spot first; no leverage unless portfolio regime is already risk-on).
When to put it on: On/after the weekly close that printed the MACD bullish cross (2026-07-26). Best if price is reclaiming or holding above the 20-week EMA; if still below a falling 20W EMA, wait for a weekly close back above it before sizing up.
Entry instructions: ENTRY: buy near $65,340 on/after 2026-07-26 using a weekly close confirmation for the pattern. Do not market-chase far above entry without a plan; if price is already >3–4% through entry, wait for a hold/retest.
Exit instructions: EXIT WIN: scale out into $71,874 (first tranche at target; trail remainder above rising 20W EMA if trend continues). EXIT LOSS: flatten or cut adds on a weekly close under invalidation $60,113. TIME EXIT: if neither target nor stop by ~13 weeks, reassess — reduce if structure weakens.
When to add: Add only on a green weekly close that keeps MACD above signal, or on a shallow retest that holds the 20W EMA.
Risk / targets: Hard invalidation / exit: weekly close below $60,113 (-8.0% from entry). First take-profit / reduce zone: $71,874 (+10.0% from entry, ~1.3R). Horizon ~13 weeks unless stopped/target hit sooner.
Size: Size: starter 25–40% of intended BTC sleeve add; leave room to add once. Prefer spot/IBIT. Options/leverage only if portfolio regime already allows heavier risk/calls.
Action: HISTORICAL PLAN (not a live order): on 2026-07-26 the play was buy near $65,340, invalidation $60,113, target/exit $71,874. Outcome: WIN.
If it fails: At the time, a weekly close under $60,113 meant exit/no add.
Weekly MACD line is -5400 vs signal -5591; histogram 191.
Evidence
MACD -5400
Signal -5591
Histogram 191
Prior histogram -27
Extra notes
Bullish momentum inflection; best when price is above/rising 20W EMA.
Use as confirmation for staged spot/IBIT exposure rather than a standalone all-in trigger.
If cross occurs below a falling 20W EMA, downgrade to watchlist-only.
Invalidation: MACD line rolls back below signal on weekly close or histogram flips materially negative.
Trade plan used: Buy a small staged long in BTC or IBIT (spot first; no leverage unless portfolio regime is already risk-on).
What trade: Buy a small staged long in BTC or IBIT (spot first; no leverage unless portfolio regime is already risk-on).
When to put it on: On/after the weekly close that printed the MACD bullish cross (2026-04-19). Best if price is reclaiming or holding above the 20-week EMA; if still below a falling 20W EMA, wait for a weekly close back above it before sizing up.
Entry instructions: ENTRY: buy near $73,856 on/after 2026-04-19 using a weekly close confirmation for the pattern. Do not market-chase far above entry without a plan; if price is already >3–4% through entry, wait for a hold/retest.
Exit instructions: EXIT WIN: scale out into $81,242 (first tranche at target; trail remainder above rising 20W EMA if trend continues). EXIT LOSS: flatten or cut adds on a weekly close under invalidation $67,948. TIME EXIT: if neither target nor stop by ~13 weeks, reassess — reduce if structure weakens.
When to add: Add only on a green weekly close that keeps MACD above signal, or on a shallow retest that holds the 20W EMA.
Risk / targets: Hard invalidation / exit: weekly close below $67,948 (-8.0% from entry). First take-profit / reduce zone: $81,242 (+10.0% from entry, ~1.3R). Horizon ~13 weeks unless stopped/target hit sooner.
Size: Size: starter 25–40% of intended BTC sleeve add; leave room to add once. Prefer spot/IBIT. Options/leverage only if portfolio regime already allows heavier risk/calls.
Action: HISTORICAL PLAN (not a live order): on 2026-04-19 the play was buy near $73,856, invalidation $67,948, target/exit $81,242. Outcome: WIN.
If it fails: At the time, a weekly close under $67,948 meant exit/no add.
Weekly MACD line is -7986 vs signal -8437; histogram 452.
Evidence
MACD -7986
Signal -8437
Histogram 452
Prior histogram -164
Extra notes
Bullish momentum inflection; best when price is above/rising 20W EMA.
Use as confirmation for staged spot/IBIT exposure rather than a standalone all-in trigger.
If cross occurs below a falling 20W EMA, downgrade to watchlist-only.
Invalidation: MACD line rolls back below signal on weekly close or histogram flips materially negative.
Trade plan used: Buy the pullback in an uptrend: staged long BTC/IBIT into the 20-week EMA zone.
What trade: Buy the pullback in an uptrend: staged long BTC/IBIT into the 20-week EMA zone.
When to put it on: When weekly price tags/holds the 20W EMA around the 2025-10-12 signal and the broader uptrend filter is still on (price and 20W EMA above the slower weekly average).
Entry instructions: ENTRY: buy near $115,170 on/after 2025-10-12 using a weekly close confirmation for the pattern. Do not market-chase far above entry without a plan; if price is already >3–4% through entry, wait for a hold/retest.
Exit instructions: EXIT WIN: scale out into $126,687 (first tranche at target; trail remainder above rising 20W EMA if trend continues). EXIT LOSS: flatten or cut adds on a weekly close under invalidation $111,507. TIME EXIT: if neither target nor stop by ~13 weeks, reassess — reduce if structure weakens.
When to add: Add on the first weekly close back above the 20W EMA after the touch, not while still slicing lower through it.
Risk / targets: Hard invalidation / exit: weekly close below $111,507 (-3.2% from entry). First take-profit / reduce zone: $126,687 (+10.0% from entry, ~3.1R). Horizon ~13 weeks unless stopped/target hit sooner.
Size: Size: starter 25–40% of intended BTC sleeve add; leave room to add once. Prefer spot/IBIT. Options/leverage only if portfolio regime already allows heavier risk/calls.
Action: HISTORICAL PLAN (not a live order): on 2025-10-12 the play was buy near $115,170, invalidation $111,507, target/exit $126,687. Outcome: LOSS.
If it fails: At the time, a weekly close under $111,507 meant exit/no add.
BTC is 3.3% from the 20-week EMA after a recent EMA-zone touch; weekly trend filter is on.
Evidence
Close $115,170 vs 20W EMA $111,507
26-week return 37.6%
20W EMA above 40W SMA
Extra notes
If already exposed: constructive add/hold zone while closes defend the 20W EMA.
Fresh long: stage, do not max-buy; prefer confirmation above this week's high or a green weekly close.
Avoid leverage if weekly close loses the 20W EMA and MACD histogram deteriorates.
Invalidation: Weekly close below 20W EMA / prior swing low zone ($104,582)
Trade plan used: Buy strength on the flag breakout: staged long BTC/IBIT.
What trade: Buy strength on the flag breakout: staged long BTC/IBIT.
When to put it on: Prefer entry on a weekly close through flag resistance near $135,865, not mid-flag. The 2025-10-05 signal marks the setup window.
Entry instructions: ENTRY: buy near $123,513 on/after 2025-10-05 using a weekly close confirmation for the pattern. Do not market-chase far above entry without a plan; if price is already >3–4% through entry, wait for a hold/retest.
Exit instructions: EXIT WIN: scale out into $135,865 (first tranche at target; trail remainder above rising 20W EMA if trend continues). EXIT LOSS: flatten or cut adds on a weekly close under invalidation $107,271. TIME EXIT: if neither target nor stop by ~13 weeks, reassess — reduce if structure weakens.
When to add: Add on a successful retest of broken flag resistance that holds as support.
Risk / targets: Hard invalidation / exit: weekly close below $107,271 (-13.2% from entry). First take-profit / reduce zone: $135,865 (+10.0% from entry, ~0.8R). Horizon ~13 weeks unless stopped/target hit sooner.
Size: Size: starter 25–40% of intended BTC sleeve add; leave room to add once. Prefer spot/IBIT. Options/leverage only if portfolio regime already allows heavier risk/calls.
Action: HISTORICAL PLAN (not a live order): on 2025-10-05 the play was buy near $123,513, invalidation $107,271, target/exit $135,865. Outcome: LOSS.
If it fails: At the time, a weekly close under $107,271 meant exit/no add.
Prior 8-week thrust max 35.1% followed by 8-week consolidation range 17.0%; breakout filter met/near.
Evidence
8W base high $125,559
8W base low $107,271
Base drift 5.2%
Volume cool-down yes
Extra notes
A weekly close through flag resistance supports adding strength.
If still inside flag, wait for breakout; avoid buying middle of range unless this overlaps 20W EMA support.
Target is measured-move/ATH zone, but trail risk below flag low.
Invalidation: Weekly close below flag low/support ($107,271)
Trade plan used: Buy the breakout above flat resistance: staged long BTC/IBIT.
What trade: Buy the breakout above flat resistance: staged long BTC/IBIT.
When to put it on: Enter on a weekly close above triangle resistance/target zone ($135,865), with expanding volume preferred. Treat 2025-10-05 as the alert date; do not front-run a failed poke.
Entry instructions: ENTRY: buy near $123,513 on/after 2025-10-05 using a weekly close confirmation for the pattern. Do not market-chase far above entry without a plan; if price is already >3–4% through entry, wait for a hold/retest.
Exit instructions: EXIT WIN: scale out into $135,865 (first tranche at target; trail remainder above rising 20W EMA if trend continues). EXIT LOSS: flatten or cut adds on a weekly close under invalidation $113,632. TIME EXIT: if neither target nor stop by ~13 weeks, reassess — reduce if structure weakens.
When to add: Add on a retest of the breakout line that holds on a weekly close.
Risk / targets: Hard invalidation / exit: weekly close below $113,632 (-8.0% from entry). First take-profit / reduce zone: $135,865 (+10.0% from entry, ~1.3R). Horizon ~13 weeks unless stopped/target hit sooner.
Size: Size: starter 25–40% of intended BTC sleeve add; leave room to add once. Prefer spot/IBIT. Options/leverage only if portfolio regime already allows heavier risk/calls.
Action: HISTORICAL PLAN (not a live order): on 2025-10-05 the play was buy near $123,513, invalidation $113,632, target/exit $135,865. Outcome: LOSS.
If it fails: At the time, a weekly close under $113,632 meant exit/no add.
Flat resistance near $120,693 with 8 touches and rising-lows slope about 11.1% over the 20-week window.
Evidence
Resistance $120,693
Touches 8
High-band width 4.3%
Breakout yes
Extra notes
Best trigger is weekly close above resistance with expanding volume.
If near resistance, wait for close/hold rather than front-running a failed breakout.
Retest of broken resistance is preferred add zone after breakout.
Invalidation: Weekly close below rising-lows trend / 20W EMA, or failed breakout back under $120,693.
Outcome reason: time stop @ horizon (close vs entry)
Trade plan used: Buy the cup-and-handle pivot breakout: smaller staged long until confirmed.
What trade: Buy the cup-and-handle pivot breakout: smaller staged long until confirmed.
When to put it on: Enter on a weekly close above the pivot ($122,284). If only the handle is forming around 2025-09-07, wait for the breakout close rather than guessing the bottom of the handle.
Entry instructions: ENTRY: buy near $111,168 on/after 2025-09-07 using a weekly close confirmation for the pattern. Do not market-chase far above entry without a plan; if price is already >3–4% through entry, wait for a hold/retest.
Exit instructions: EXIT WIN: scale out into $122,284 (first tranche at target; trail remainder above rising 20W EMA if trend continues). EXIT LOSS: flatten or cut adds on a weekly close under invalidation $98,286. TIME EXIT: if neither target nor stop by ~13 weeks, reassess — reduce if structure weakens.
When to add: Add only after the breakout holds for a full weekly close and the handle low stays intact.
Risk / targets: Hard invalidation / exit: weekly close below $98,286 (-11.6% from entry). First take-profit / reduce zone: $122,284 (+10.0% from entry, ~0.9R). Horizon ~13 weeks unless stopped/target hit sooner.
Size: Size: starter 25–40% of intended BTC sleeve add; leave room to add once. Prefer spot/IBIT. Options/leverage only if portfolio regime already allows heavier risk/calls.
Action: HISTORICAL PLAN (not a live order): on 2025-09-07 the play was buy near $111,168, invalidation $98,286, target/exit $122,284. Outcome: WIN.
If it fails: At the time, a weekly close under $98,286 meant exit/no add.
Potential rounded base: cup depth 33.4%, recovery to 51.8% from left rim, handle depth 12.2%; pivot near $111,970.
Evidence
Left rim $73,750
Cup low $49,121
Right rim $111,970
Pivot $111,970
Breakout near/no
Extra notes
Treat as lower-confidence algorithmic pattern until visually confirmed on TradingView weekly candles.
Trigger is weekly close above pivot; handle should stay orderly and above 20W EMA.
Size smaller than EMA/MACD signals unless breakout volume confirms.
Invalidation: Handle low violation ($98,286) or weekly close back below pivot after breakout.
Trade plan used: Buy the pullback in an uptrend: staged long BTC/IBIT into the 20-week EMA zone.
What trade: Buy the pullback in an uptrend: staged long BTC/IBIT into the 20-week EMA zone.
When to put it on: When weekly price tags/holds the 20W EMA around the 2025-08-17 signal and the broader uptrend filter is still on (price and 20W EMA above the slower weekly average).
Entry instructions: ENTRY: buy near $117,453 on/after 2025-08-17 using a weekly close confirmation for the pattern. Do not market-chase far above entry without a plan; if price is already >3–4% through entry, wait for a hold/retest.
Exit instructions: EXIT WIN: scale out into $129,198 (first tranche at target; trail remainder above rising 20W EMA if trend continues). EXIT LOSS: flatten or cut adds on a weekly close under invalidation $107,388. TIME EXIT: if neither target nor stop by ~13 weeks, reassess — reduce if structure weakens.
When to add: Add on the first weekly close back above the 20W EMA after the touch, not while still slicing lower through it.
Risk / targets: Hard invalidation / exit: weekly close below $107,388 (-8.6% from entry). First take-profit / reduce zone: $129,198 (+10.0% from entry, ~1.2R). Horizon ~13 weeks unless stopped/target hit sooner.
Size: Size: starter 25–40% of intended BTC sleeve add; leave room to add once. Prefer spot/IBIT. Options/leverage only if portfolio regime already allows heavier risk/calls.
Action: HISTORICAL PLAN (not a live order): on 2025-08-17 the play was buy near $117,453, invalidation $107,388, target/exit $129,198. Outcome: LOSS.
If it fails: At the time, a weekly close under $107,388 meant exit/no add.
BTC is 9.4% from the 20-week EMA after a recent EMA-zone touch; weekly trend filter is on.
Evidence
Close $117,453 vs 20W EMA $107,388
26-week return 22.1%
20W EMA above 40W SMA
Extra notes
If already exposed: constructive add/hold zone while closes defend the 20W EMA.
Fresh long: stage, do not max-buy; prefer confirmation above this week's high or a green weekly close.
Avoid leverage if weekly close loses the 20W EMA and MACD histogram deteriorates.
Invalidation: Weekly close below 20W EMA / prior swing low zone ($99,706)
Trade plan used: Buy the breakout above flat resistance: staged long BTC/IBIT.
What trade: Buy the breakout above flat resistance: staged long BTC/IBIT.
When to put it on: Enter on a weekly close above triangle resistance/target zone ($131,393), with expanding volume preferred. Treat 2025-07-27 as the alert date; do not front-run a failed poke.
Entry instructions: ENTRY: buy near $119,448 on/after 2025-07-27 using a weekly close confirmation for the pattern. Do not market-chase far above entry without a plan; if price is already >3–4% through entry, wait for a hold/retest.
Exit instructions: EXIT WIN: scale out into $131,393 (first tranche at target; trail remainder above rising 20W EMA if trend continues). EXIT LOSS: flatten or cut adds on a weekly close under invalidation $109,892. TIME EXIT: if neither target nor stop by ~13 weeks, reassess — reduce if structure weakens.
When to add: Add on a retest of the breakout line that holds on a weekly close.
Risk / targets: Hard invalidation / exit: weekly close below $109,892 (-8.0% from entry). First take-profit / reduce zone: $131,393 (+10.0% from entry, ~1.3R). Horizon ~13 weeks unless stopped/target hit sooner.
Size: Size: starter 25–40% of intended BTC sleeve add; leave room to add once. Prefer spot/IBIT. Options/leverage only if portfolio regime already allows heavier risk/calls.
Action: HISTORICAL PLAN (not a live order): on 2025-07-27 the play was buy near $119,448, invalidation $109,892, target/exit $131,393. Outcome: LOSS.
If it fails: At the time, a weekly close under $109,892 meant exit/no add.
Flat resistance near $113,092 with 7 touches and rising-lows slope about 40.3% over the 20-week window.
Evidence
Resistance $113,092
Touches 7
High-band width 8.9%
Breakout yes
Extra notes
Best trigger is weekly close above resistance with expanding volume.
If near resistance, wait for close/hold rather than front-running a failed breakout.
Retest of broken resistance is preferred add zone after breakout.
Invalidation: Weekly close below rising-lows trend / 20W EMA, or failed breakout back under $113,092.
Outcome reason: time stop @ horizon (close vs entry)
Trade plan used: Buy the cup-and-handle pivot breakout: smaller staged long until confirmed.
What trade: Buy the cup-and-handle pivot breakout: smaller staged long until confirmed.
When to put it on: Enter on a weekly close above the pivot ($131,028). If only the handle is forming around 2025-07-13, wait for the breakout close rather than guessing the bottom of the handle.
Entry instructions: ENTRY: buy near $119,116 on/after 2025-07-13 using a weekly close confirmation for the pattern. Do not market-chase far above entry without a plan; if price is already >3–4% through entry, wait for a hold/retest.
Exit instructions: EXIT WIN: scale out into $131,028 (first tranche at target; trail remainder above rising 20W EMA if trend continues). EXIT LOSS: flatten or cut adds on a weekly close under invalidation $85,144. TIME EXIT: if neither target nor stop by ~13 weeks, reassess — reduce if structure weakens.
When to add: Add only after the breakout holds for a full weekly close and the handle low stays intact.
Risk / targets: Hard invalidation / exit: weekly close below $85,144 (-28.5% from entry). First take-profit / reduce zone: $131,028 (+10.0% from entry, ~0.4R). Horizon ~13 weeks unless stopped/target hit sooner.
Size: Size: starter 25–40% of intended BTC sleeve add; leave room to add once. Prefer spot/IBIT. Options/leverage only if portfolio regime already allows heavier risk/calls.
Action: HISTORICAL PLAN (not a live order): on 2025-07-13 the play was buy near $119,116, invalidation $85,144, target/exit $131,028. Outcome: LOSS.
If it fails: At the time, a weekly close under $85,144 meant exit/no add.
Potential rounded base: cup depth 33.4%, recovery to 48.0% from left rim, handle depth 22.0%; pivot near $109,115.
Evidence
Left rim $73,750
Cup low $49,121
Right rim $109,115
Pivot $109,115
Breakout yes
Extra notes
Treat as lower-confidence algorithmic pattern until visually confirmed on TradingView weekly candles.
Trigger is weekly close above pivot; handle should stay orderly and above 20W EMA.
Size smaller than EMA/MACD signals unless breakout volume confirms.
Invalidation: Handle low violation ($85,144) or weekly close back below pivot after breakout.
Outcome reason: time stop @ horizon (close vs entry)
Trade plan used: Buy strength on the flag breakout: staged long BTC/IBIT.
What trade: Buy strength on the flag breakout: staged long BTC/IBIT.
When to put it on: Prefer entry on a weekly close through flag resistance near $111,970, not mid-flag. The 2025-07-06 signal marks the setup window.
Entry instructions: ENTRY: buy near $109,232 on/after 2025-07-06 using a weekly close confirmation for the pattern. Do not market-chase far above entry without a plan; if price is already >3–4% through entry, wait for a hold/retest.
Exit instructions: EXIT WIN: scale out into $111,970 (first tranche at target; trail remainder above rising 20W EMA if trend continues). EXIT LOSS: flatten or cut adds on a weekly close under invalidation $98,286. TIME EXIT: if neither target nor stop by ~13 weeks, reassess — reduce if structure weakens.
When to add: Add on a successful retest of broken flag resistance that holds as support.
Risk / targets: Hard invalidation / exit: weekly close below $98,286 (-10.0% from entry). First take-profit / reduce zone: $111,970 (+2.5% from entry, ~0.3R). Horizon ~13 weeks unless stopped/target hit sooner.
Size: Size: starter 25–40% of intended BTC sleeve add; leave room to add once. Prefer spot/IBIT. Options/leverage only if portfolio regime already allows heavier risk/calls.
Action: HISTORICAL PLAN (not a live order): on 2025-07-06 the play was buy near $109,232, invalidation $98,286, target/exit $111,970. Outcome: WIN.
If it fails: At the time, a weekly close under $98,286 meant exit/no add.
Prior 8-week thrust max 61.1% followed by 8-week consolidation range 13.9%; breakout filter not met.
Evidence
8W base high $111,970
8W base low $98,286
Base drift 2.6%
Volume cool-down yes
Extra notes
A weekly close through flag resistance supports adding strength.
If still inside flag, wait for breakout; avoid buying middle of range unless this overlaps 20W EMA support.
Target is measured-move/ATH zone, but trail risk below flag low.
Invalidation: Weekly close below flag low/support ($98,286)
Trade plan used: Buy the pullback in an uptrend: staged long BTC/IBIT into the 20-week EMA zone.
What trade: Buy the pullback in an uptrend: staged long BTC/IBIT into the 20-week EMA zone.
When to put it on: When weekly price tags/holds the 20W EMA around the 2025-06-22 signal and the broader uptrend filter is still on (price and 20W EMA above the slower weekly average).
Entry instructions: ENTRY: buy near $100,987 on/after 2025-06-22 using a weekly close confirmation for the pattern. Do not market-chase far above entry without a plan; if price is already >3–4% through entry, wait for a hold/retest.
Exit instructions: EXIT WIN: scale out into $111,086 (first tranche at target; trail remainder above rising 20W EMA if trend continues). EXIT LOSS: flatten or cut adds on a weekly close under invalidation $96,648. TIME EXIT: if neither target nor stop by ~13 weeks, reassess — reduce if structure weakens.
When to add: Add on the first weekly close back above the 20W EMA after the touch, not while still slicing lower through it.
Risk / targets: Hard invalidation / exit: weekly close below $96,648 (-4.3% from entry). First take-profit / reduce zone: $111,086 (+10.0% from entry, ~2.3R). Horizon ~13 weeks unless stopped/target hit sooner.
Size: Size: starter 25–40% of intended BTC sleeve add; leave room to add once. Prefer spot/IBIT. Options/leverage only if portfolio regime already allows heavier risk/calls.
Action: HISTORICAL PLAN (not a live order): on 2025-06-22 the play was buy near $100,987, invalidation $96,648, target/exit $111,086. Outcome: WIN.
If it fails: At the time, a weekly close under $96,648 meant exit/no add.
BTC is 4.5% from the 20-week EMA after a recent EMA-zone touch; weekly trend filter is on.
Evidence
Close $100,987 vs 20W EMA $96,648
26-week return 6.2%
20W EMA above 40W SMA
Extra notes
If already exposed: constructive add/hold zone while closes defend the 20W EMA.
Fresh long: stage, do not max-buy; prefer confirmation above this week's high or a green weekly close.
Avoid leverage if weekly close loses the 20W EMA and MACD histogram deteriorates.
Invalidation: Weekly close below 20W EMA / prior swing low zone ($92,861)
Trade plan used: Buy the breakout above flat resistance: staged long BTC/IBIT.
What trade: Buy the breakout above flat resistance: staged long BTC/IBIT.
When to put it on: Enter on a weekly close above triangle resistance/target zone ($116,217), with expanding volume preferred. Treat 2025-06-01 as the alert date; do not front-run a failed poke.
Entry instructions: ENTRY: buy near $105,652 on/after 2025-06-01 using a weekly close confirmation for the pattern. Do not market-chase far above entry without a plan; if price is already >3–4% through entry, wait for a hold/retest.
Exit instructions: EXIT WIN: scale out into $116,217 (first tranche at target; trail remainder above rising 20W EMA if trend continues). EXIT LOSS: flatten or cut adds on a weekly close under invalidation $97,200. TIME EXIT: if neither target nor stop by ~13 weeks, reassess — reduce if structure weakens.
When to add: Add on a retest of the breakout line that holds on a weekly close.
Risk / targets: Hard invalidation / exit: weekly close below $97,200 (-8.0% from entry). First take-profit / reduce zone: $116,217 (+10.0% from entry, ~1.2R). Horizon ~13 weeks unless stopped/target hit sooner.
Size: Size: starter 25–40% of intended BTC sleeve add; leave room to add once. Prefer spot/IBIT. Options/leverage only if portfolio regime already allows heavier risk/calls.
Action: HISTORICAL PLAN (not a live order): on 2025-06-01 the play was buy near $105,652, invalidation $97,200, target/exit $116,217. Outcome: WIN.
If it fails: At the time, a weekly close under $97,200 meant exit/no add.
Flat resistance near $106,975 with 7 touches and rising-lows slope about 5.2% over the 20-week window.
Evidence
Resistance $106,975
Touches 7
High-band width 5.2%
Breakout near/no
Extra notes
Best trigger is weekly close above resistance with expanding volume.
If near resistance, wait for close/hold rather than front-running a failed breakout.
Retest of broken resistance is preferred add zone after breakout.
Invalidation: Weekly close below rising-lows trend / 20W EMA, or failed breakout back under $106,975.
Trade plan used: Buy a small staged long in BTC or IBIT (spot first; no leverage unless portfolio regime is already risk-on).
What trade: Buy a small staged long in BTC or IBIT (spot first; no leverage unless portfolio regime is already risk-on).
When to put it on: On/after the weekly close that printed the MACD bullish cross (2025-05-11). Best if price is reclaiming or holding above the 20-week EMA; if still below a falling 20W EMA, wait for a weekly close back above it before sizing up.
Entry instructions: ENTRY: buy near $104,106 on/after 2025-05-11 using a weekly close confirmation for the pattern. Do not market-chase far above entry without a plan; if price is already >3–4% through entry, wait for a hold/retest.
Exit instructions: EXIT WIN: scale out into $114,517 (first tranche at target; trail remainder above rising 20W EMA if trend continues). EXIT LOSS: flatten or cut adds on a weekly close under invalidation $95,778. TIME EXIT: if neither target nor stop by ~13 weeks, reassess — reduce if structure weakens.
When to add: Add only on a green weekly close that keeps MACD above signal, or on a shallow retest that holds the 20W EMA.
Risk / targets: Hard invalidation / exit: weekly close below $95,778 (-8.0% from entry). First take-profit / reduce zone: $114,517 (+10.0% from entry, ~1.3R). Horizon ~13 weeks unless stopped/target hit sooner.
Size: Size: starter 25–40% of intended BTC sleeve add; leave room to add once. Prefer spot/IBIT. Options/leverage only if portfolio regime already allows heavier risk/calls.
Action: HISTORICAL PLAN (not a live order): on 2025-05-11 the play was buy near $104,106, invalidation $95,778, target/exit $114,517. Outcome: WIN.
If it fails: At the time, a weekly close under $95,778 meant exit/no add.
Weekly MACD line is 3092 vs signal 3029; histogram 62.
Evidence
MACD 3092
Signal 3029
Histogram 62
Prior histogram -1000
Extra notes
Bullish momentum inflection; best when price is above/rising 20W EMA.
Use as confirmation for staged spot/IBIT exposure rather than a standalone all-in trigger.
If cross occurs below a falling 20W EMA, downgrade to watchlist-only.
Invalidation: MACD line rolls back below signal on weekly close or histogram flips materially negative.
Trade plan used: Buy the pullback in an uptrend: staged long BTC/IBIT into the 20-week EMA zone.
What trade: Buy the pullback in an uptrend: staged long BTC/IBIT into the 20-week EMA zone.
When to put it on: When weekly price tags/holds the 20W EMA around the 2025-04-27 signal and the broader uptrend filter is still on (price and 20W EMA above the slower weekly average).
Entry instructions: ENTRY: buy near $93,755 on/after 2025-04-27 using a weekly close confirmation for the pattern. Do not market-chase far above entry without a plan; if price is already >3–4% through entry, wait for a hold/retest.
Exit instructions: EXIT WIN: scale out into $103,130 (first tranche at target; trail remainder above rising 20W EMA if trend continues). EXIT LOSS: flatten or cut adds on a weekly close under invalidation $87,375. TIME EXIT: if neither target nor stop by ~13 weeks, reassess — reduce if structure weakens.
When to add: Add on the first weekly close back above the 20W EMA after the touch, not while still slicing lower through it.
Risk / targets: Hard invalidation / exit: weekly close below $87,375 (-6.8% from entry). First take-profit / reduce zone: $103,130 (+10.0% from entry, ~1.5R). Horizon ~13 weeks unless stopped/target hit sooner.
Size: Size: starter 25–40% of intended BTC sleeve add; leave room to add once. Prefer spot/IBIT. Options/leverage only if portfolio regime already allows heavier risk/calls.
Action: HISTORICAL PLAN (not a live order): on 2025-04-27 the play was buy near $93,755, invalidation $87,375, target/exit $103,130. Outcome: WIN.
If it fails: At the time, a weekly close under $87,375 meant exit/no add.
BTC is 7.3% from the 20-week EMA after a recent EMA-zone touch; weekly trend filter is on.
Evidence
Close $93,755 vs 20W EMA $87,375
26-week return 38.0%
20W EMA above 40W SMA
Extra notes
If already exposed: constructive add/hold zone while closes defend the 20W EMA.
Fresh long: stage, do not max-buy; prefer confirmation above this week's high or a green weekly close.
Avoid leverage if weekly close loses the 20W EMA and MACD histogram deteriorates.
Invalidation: Weekly close below 20W EMA / prior swing low zone ($74,437)
Trade plan used: Buy the pullback in an uptrend: staged long BTC/IBIT into the 20-week EMA zone.
What trade: Buy the pullback in an uptrend: staged long BTC/IBIT into the 20-week EMA zone.
When to put it on: When weekly price tags/holds the 20W EMA around the 2025-03-02 signal and the broader uptrend filter is still on (price and 20W EMA above the slower weekly average).
Entry instructions: ENTRY: buy near $94,248 on/after 2025-03-02 using a weekly close confirmation for the pattern. Do not market-chase far above entry without a plan; if price is already >3–4% through entry, wait for a hold/retest.
Exit instructions: EXIT WIN: scale out into $103,673 (first tranche at target; trail remainder above rising 20W EMA if trend continues). EXIT LOSS: flatten or cut adds on a weekly close under invalidation $90,680. TIME EXIT: if neither target nor stop by ~13 weeks, reassess — reduce if structure weakens.
When to add: Add on the first weekly close back above the 20W EMA after the touch, not while still slicing lower through it.
Risk / targets: Hard invalidation / exit: weekly close below $90,680 (-3.8% from entry). First take-profit / reduce zone: $103,673 (+10.0% from entry, ~2.6R). Horizon ~13 weeks unless stopped/target hit sooner.
Size: Size: starter 25–40% of intended BTC sleeve add; leave room to add once. Prefer spot/IBIT. Options/leverage only if portfolio regime already allows heavier risk/calls.
Action: HISTORICAL PLAN (not a live order): on 2025-03-02 the play was buy near $94,248, invalidation $90,680, target/exit $103,673. Outcome: LOSS.
If it fails: At the time, a weekly close under $90,680 meant exit/no add.
BTC is 3.9% from the 20-week EMA after a recent EMA-zone touch; weekly trend filter is on.
Evidence
Close $94,248 vs 20W EMA $90,680
26-week return 64.4%
20W EMA above 40W SMA
Extra notes
If already exposed: constructive add/hold zone while closes defend the 20W EMA.
Fresh long: stage, do not max-buy; prefer confirmation above this week's high or a green weekly close.
Avoid leverage if weekly close loses the 20W EMA and MACD histogram deteriorates.
Invalidation: Weekly close below 20W EMA / prior swing low zone ($78,249)
Trade plan used: Buy the breakout above flat resistance: staged long BTC/IBIT.
What trade: Buy the breakout above flat resistance: staged long BTC/IBIT.
When to put it on: Enter on a weekly close above triangle resistance/target zone ($100,487), with expanding volume preferred. Treat 2025-01-05 as the alert date; do not front-run a failed poke.
Entry instructions: ENTRY: buy near $98,315 on/after 2025-01-05 using a weekly close confirmation for the pattern. Do not market-chase far above entry without a plan; if price is already >3–4% through entry, wait for a hold/retest.
Exit instructions: EXIT WIN: scale out into $100,487 (first tranche at target; trail remainder above rising 20W EMA if trend continues). EXIT LOSS: flatten or cut adds on a weekly close under invalidation $1. TIME EXIT: if neither target nor stop by ~13 weeks, reassess — reduce if structure weakens.
When to add: Add on a retest of the breakout line that holds on a weekly close.
Risk / targets: Hard invalidation / exit: weekly close below $1 (-100.0% from entry). First take-profit / reduce zone: $100,487 (+2.2% from entry, ~0.0R). Horizon ~13 weeks unless stopped/target hit sooner.
Size: Size: starter 25–40% of intended BTC sleeve add; leave room to add once. Prefer spot/IBIT. Options/leverage only if portfolio regime already allows heavier risk/calls.
Action: HISTORICAL PLAN (not a live order): on 2025-01-05 the play was buy near $98,315, invalidation $1, target/exit $100,487. Outcome: WIN.
If it fails: At the time, a weekly close under $1 meant exit/no add.
Flat resistance near $100,487 with 7 touches and rising-lows slope about 64.0% over the 20-week window.
Evidence
Resistance $100,487
Touches 7
High-band width 6.3%
Breakout near/no
Extra notes
Best trigger is weekly close above resistance with expanding volume.
If near resistance, wait for close/hold rather than front-running a failed breakout.
Retest of broken resistance is preferred add zone after breakout.
Invalidation: Weekly close below rising-lows trend / 20W EMA, or failed breakout back under $100,487.
Trade plan used: Buy the breakout above flat resistance: staged long BTC/IBIT.
What trade: Buy the breakout above flat resistance: staged long BTC/IBIT.
When to put it on: Enter on a weekly close above triangle resistance/target zone ($75,615), with expanding volume preferred. Treat 2024-11-03 as the alert date; do not front-run a failed poke.
Entry instructions: ENTRY: buy near $68,741 on/after 2024-11-03 using a weekly close confirmation for the pattern. Do not market-chase far above entry without a plan; if price is already >3–4% through entry, wait for a hold/retest.
Exit instructions: EXIT WIN: scale out into $75,615 (first tranche at target; trail remainder above rising 20W EMA if trend continues). EXIT LOSS: flatten or cut adds on a weekly close under invalidation $63,242. TIME EXIT: if neither target nor stop by ~13 weeks, reassess — reduce if structure weakens.
When to add: Add on a retest of the breakout line that holds on a weekly close.
Risk / targets: Hard invalidation / exit: weekly close below $63,242 (-8.0% from entry). First take-profit / reduce zone: $75,615 (+10.0% from entry, ~1.2R). Horizon ~13 weeks unless stopped/target hit sooner.
Size: Size: starter 25–40% of intended BTC sleeve add; leave room to add once. Prefer spot/IBIT. Options/leverage only if portfolio regime already allows heavier risk/calls.
Action: HISTORICAL PLAN (not a live order): on 2024-11-03 the play was buy near $68,741, invalidation $63,242, target/exit $75,615. Outcome: WIN.
If it fails: At the time, a weekly close under $63,242 meant exit/no add.
Flat resistance near $69,408 with 6 touches and rising-lows slope about 9.3% over the 20-week window.
Evidence
Resistance $69,408
Touches 6
High-band width 3.9%
Breakout near/no
Extra notes
Best trigger is weekly close above resistance with expanding volume.
If near resistance, wait for close/hold rather than front-running a failed breakout.
Retest of broken resistance is preferred add zone after breakout.
Invalidation: Weekly close below rising-lows trend / 20W EMA, or failed breakout back under $69,408.
Trade plan used: Buy the pullback in an uptrend: staged long BTC/IBIT into the 20-week EMA zone.
What trade: Buy the pullback in an uptrend: staged long BTC/IBIT into the 20-week EMA zone.
When to put it on: When weekly price tags/holds the 20W EMA around the 2024-10-20 signal and the broader uptrend filter is still on (price and 20W EMA above the slower weekly average).
Entry instructions: ENTRY: buy near $69,002 on/after 2024-10-20 using a weekly close confirmation for the pattern. Do not market-chase far above entry without a plan; if price is already >3–4% through entry, wait for a hold/retest.
Exit instructions: EXIT WIN: scale out into $75,902 (first tranche at target; trail remainder above rising 20W EMA if trend continues). EXIT LOSS: flatten or cut adds on a weekly close under invalidation $62,280. TIME EXIT: if neither target nor stop by ~13 weeks, reassess — reduce if structure weakens.
When to add: Add on the first weekly close back above the 20W EMA after the touch, not while still slicing lower through it.
Risk / targets: Hard invalidation / exit: weekly close below $62,280 (-9.7% from entry). First take-profit / reduce zone: $75,902 (+10.0% from entry, ~1.0R). Horizon ~13 weeks unless stopped/target hit sooner.
Size: Size: starter 25–40% of intended BTC sleeve add; leave room to add once. Prefer spot/IBIT. Options/leverage only if portfolio regime already allows heavier risk/calls.
Action: HISTORICAL PLAN (not a live order): on 2024-10-20 the play was buy near $69,002, invalidation $62,280, target/exit $75,902. Outcome: WIN.
If it fails: At the time, a weekly close under $62,280 meant exit/no add.
BTC is 10.8% from the 20-week EMA after a recent EMA-zone touch; weekly trend filter is on.
Evidence
Close $69,002 vs 20W EMA $62,280
26-week return 6.3%
20W EMA above 40W SMA
Extra notes
If already exposed: constructive add/hold zone while closes defend the 20W EMA.
Fresh long: stage, do not max-buy; prefer confirmation above this week's high or a green weekly close.
Avoid leverage if weekly close loses the 20W EMA and MACD histogram deteriorates.
Invalidation: Weekly close below 20W EMA / prior swing low zone ($52,599)
Trade plan used: Buy a small staged long in BTC or IBIT (spot first; no leverage unless portfolio regime is already risk-on).
What trade: Buy a small staged long in BTC or IBIT (spot first; no leverage unless portfolio regime is already risk-on).
When to put it on: On/after the weekly close that printed the MACD bullish cross (2024-10-20). Best if price is reclaiming or holding above the 20-week EMA; if still below a falling 20W EMA, wait for a weekly close back above it before sizing up.
Entry instructions: ENTRY: buy near $69,002 on/after 2024-10-20 using a weekly close confirmation for the pattern. Do not market-chase far above entry without a plan; if price is already >3–4% through entry, wait for a hold/retest.
Exit instructions: EXIT WIN: scale out into $75,902 (first tranche at target; trail remainder above rising 20W EMA if trend continues). EXIT LOSS: flatten or cut adds on a weekly close under invalidation $63,482. TIME EXIT: if neither target nor stop by ~13 weeks, reassess — reduce if structure weakens.
When to add: Add only on a green weekly close that keeps MACD above signal, or on a shallow retest that holds the 20W EMA.
Risk / targets: Hard invalidation / exit: weekly close below $63,482 (-8.0% from entry). First take-profit / reduce zone: $75,902 (+10.0% from entry, ~1.2R). Horizon ~13 weeks unless stopped/target hit sooner.
Size: Size: starter 25–40% of intended BTC sleeve add; leave room to add once. Prefer spot/IBIT. Options/leverage only if portfolio regime already allows heavier risk/calls.
Action: HISTORICAL PLAN (not a live order): on 2024-10-20 the play was buy near $69,002, invalidation $63,482, target/exit $75,902. Outcome: WIN.
If it fails: At the time, a weekly close under $63,482 meant exit/no add.
Weekly MACD line is 1648 vs signal 1568; histogram 80.
Evidence
MACD 1648
Signal 1568
Histogram 80
Prior histogram -375
Extra notes
Bullish momentum inflection; best when price is above/rising 20W EMA.
Use as confirmation for staged spot/IBIT exposure rather than a standalone all-in trigger.
If cross occurs below a falling 20W EMA, downgrade to watchlist-only.
Invalidation: MACD line rolls back below signal on weekly close or histogram flips materially negative.
Trade plan used: Buy the pullback in an uptrend: staged long BTC/IBIT into the 20-week EMA zone.
What trade: Buy the pullback in an uptrend: staged long BTC/IBIT into the 20-week EMA zone.
When to put it on: When weekly price tags/holds the 20W EMA around the 2024-08-25 signal and the broader uptrend filter is still on (price and 20W EMA above the slower weekly average).
Entry instructions: ENTRY: buy near $64,334 on/after 2024-08-25 using a weekly close confirmation for the pattern. Do not market-chase far above entry without a plan; if price is already >3–4% through entry, wait for a hold/retest.
Exit instructions: EXIT WIN: scale out into $70,767 (first tranche at target; trail remainder above rising 20W EMA if trend continues). EXIT LOSS: flatten or cut adds on a weekly close under invalidation $61,715. TIME EXIT: if neither target nor stop by ~13 weeks, reassess — reduce if structure weakens.
When to add: Add on the first weekly close back above the 20W EMA after the touch, not while still slicing lower through it.
Risk / targets: Hard invalidation / exit: weekly close below $61,715 (-4.1% from entry). First take-profit / reduce zone: $70,767 (+10.0% from entry, ~2.5R). Horizon ~13 weeks unless stopped/target hit sooner.
Size: Size: starter 25–40% of intended BTC sleeve add; leave room to add once. Prefer spot/IBIT. Options/leverage only if portfolio regime already allows heavier risk/calls.
Action: HISTORICAL PLAN (not a live order): on 2024-08-25 the play was buy near $64,334, invalidation $61,715, target/exit $70,767. Outcome: LOSS.
If it fails: At the time, a weekly close under $61,715 meant exit/no add.
BTC is 4.2% from the 20-week EMA after a recent EMA-zone touch; weekly trend filter is on.
Evidence
Close $64,334 vs 20W EMA $61,715
26-week return 24.4%
20W EMA above 40W SMA
Extra notes
If already exposed: constructive add/hold zone while closes defend the 20W EMA.
Fresh long: stage, do not max-buy; prefer confirmation above this week's high or a green weekly close.
Avoid leverage if weekly close loses the 20W EMA and MACD histogram deteriorates.
Invalidation: Weekly close below 20W EMA / prior swing low zone ($49,121)
Trade plan used: Buy the pullback in an uptrend: staged long BTC/IBIT into the 20-week EMA zone.
What trade: Buy the pullback in an uptrend: staged long BTC/IBIT into the 20-week EMA zone.
When to put it on: When weekly price tags/holds the 20W EMA around the 2024-06-30 signal and the broader uptrend filter is still on (price and 20W EMA above the slower weekly average).
Entry instructions: ENTRY: buy near $62,678 on/after 2024-06-30 using a weekly close confirmation for the pattern. Do not market-chase far above entry without a plan; if price is already >3–4% through entry, wait for a hold/retest.
Exit instructions: EXIT WIN: scale out into $68,946 (first tranche at target; trail remainder above rising 20W EMA if trend continues). EXIT LOSS: flatten or cut adds on a weekly close under invalidation $61,832. TIME EXIT: if neither target nor stop by ~13 weeks, reassess — reduce if structure weakens.
When to add: Add on the first weekly close back above the 20W EMA after the touch, not while still slicing lower through it.
Risk / targets: Hard invalidation / exit: weekly close below $61,832 (-1.3% from entry). First take-profit / reduce zone: $68,946 (+10.0% from entry, ~7.4R). Horizon ~13 weeks unless stopped/target hit sooner.
Size: Size: starter 25–40% of intended BTC sleeve add; leave room to add once. Prefer spot/IBIT. Options/leverage only if portfolio regime already allows heavier risk/calls.
Action: HISTORICAL PLAN (not a live order): on 2024-06-30 the play was buy near $62,678, invalidation $61,832, target/exit $68,946. Outcome: LOSS.
If it fails: At the time, a weekly close under $61,832 meant exit/no add.
BTC is 1.4% from the 20-week EMA after a recent EMA-zone touch; weekly trend filter is on.
Evidence
Close $62,678 vs 20W EMA $61,832
26-week return 48.3%
20W EMA above 40W SMA
Extra notes
If already exposed: constructive add/hold zone while closes defend the 20W EMA.
Fresh long: stage, do not max-buy; prefer confirmation above this week's high or a green weekly close.
Avoid leverage if weekly close loses the 20W EMA and MACD histogram deteriorates.
Invalidation: Weekly close below 20W EMA / prior swing low zone ($58,602)
Trade plan used: Buy the pullback in an uptrend: staged long BTC/IBIT into the 20-week EMA zone.
What trade: Buy the pullback in an uptrend: staged long BTC/IBIT into the 20-week EMA zone.
When to put it on: When weekly price tags/holds the 20W EMA around the 2024-05-05 signal and the broader uptrend filter is still on (price and 20W EMA above the slower weekly average).
Entry instructions: ENTRY: buy near $64,031 on/after 2024-05-05 using a weekly close confirmation for the pattern. Do not market-chase far above entry without a plan; if price is already >3–4% through entry, wait for a hold/retest.
Exit instructions: EXIT WIN: scale out into $70,434 (first tranche at target; trail remainder above rising 20W EMA if trend continues). EXIT LOSS: flatten or cut adds on a weekly close under invalidation $57,154. TIME EXIT: if neither target nor stop by ~13 weeks, reassess — reduce if structure weakens.
When to add: Add on the first weekly close back above the 20W EMA after the touch, not while still slicing lower through it.
Risk / targets: Hard invalidation / exit: weekly close below $57,154 (-10.7% from entry). First take-profit / reduce zone: $70,434 (+10.0% from entry, ~0.9R). Horizon ~13 weeks unless stopped/target hit sooner.
Size: Size: starter 25–40% of intended BTC sleeve add; leave room to add once. Prefer spot/IBIT. Options/leverage only if portfolio regime already allows heavier risk/calls.
Action: HISTORICAL PLAN (not a live order): on 2024-05-05 the play was buy near $64,031, invalidation $57,154, target/exit $70,434. Outcome: WIN.
If it fails: At the time, a weekly close under $57,154 meant exit/no add.
BTC is 12.0% from the 20-week EMA after a recent EMA-zone touch; weekly trend filter is on.
Evidence
Close $64,031 vs 20W EMA $57,154
26-week return 82.7%
20W EMA above 40W SMA
Extra notes
If already exposed: constructive add/hold zone while closes defend the 20W EMA.
Fresh long: stage, do not max-buy; prefer confirmation above this week's high or a green weekly close.
Avoid leverage if weekly close loses the 20W EMA and MACD histogram deteriorates.
Invalidation: Weekly close below 20W EMA / prior swing low zone ($56,555)
Trade plan used: Buy the cup-and-handle pivot breakout: smaller staged long until confirmed.
What trade: Buy the cup-and-handle pivot breakout: smaller staged long until confirmed.
When to put it on: Enter on a weekly close above the pivot ($70,434). If only the handle is forming around 2024-05-05, wait for the breakout close rather than guessing the bottom of the handle.
Entry instructions: ENTRY: buy near $64,031 on/after 2024-05-05 using a weekly close confirmation for the pattern. Do not market-chase far above entry without a plan; if price is already >3–4% through entry, wait for a hold/retest.
Exit instructions: EXIT WIN: scale out into $70,434 (first tranche at target; trail remainder above rising 20W EMA if trend continues). EXIT LOSS: flatten or cut adds on a weekly close under invalidation $50,562. TIME EXIT: if neither target nor stop by ~13 weeks, reassess — reduce if structure weakens.
When to add: Add only after the breakout holds for a full weekly close and the handle low stays intact.
Risk / targets: Hard invalidation / exit: weekly close below $50,562 (-21.0% from entry). First take-profit / reduce zone: $70,434 (+10.0% from entry, ~0.5R). Horizon ~13 weeks unless stopped/target hit sooner.
Size: Size: starter 25–40% of intended BTC sleeve add; leave room to add once. Prefer spot/IBIT. Options/leverage only if portfolio regime already allows heavier risk/calls.
Action: HISTORICAL PLAN (not a live order): on 2024-05-05 the play was buy near $64,031, invalidation $50,562, target/exit $70,434. Outcome: WIN.
If it fails: At the time, a weekly close under $50,562 meant exit/no add.
Potential rounded base: cup depth 20.0%, recovery to 70.8% from left rim, handle depth 4.5%; pivot near $52,945.
Evidence
Left rim $31,006
Cup low $24,797
Right rim $52,945
Pivot $52,945
Breakout yes
Extra notes
Treat as lower-confidence algorithmic pattern until visually confirmed on TradingView weekly candles.
Trigger is weekly close above pivot; handle should stay orderly and above 20W EMA.
Size smaller than EMA/MACD signals unless breakout volume confirms.
Invalidation: Handle low violation ($50,562) or weekly close back below pivot after breakout.
Trade plan used: Buy the breakout above flat resistance: staged long BTC/IBIT.
What trade: Buy the breakout above flat resistance: staged long BTC/IBIT.
When to put it on: Enter on a weekly close above triangle resistance/target zone ($53,123), with expanding volume preferred. Treat 2024-02-11 as the alert date; do not front-run a failed poke.
Entry instructions: ENTRY: buy near $48,294 on/after 2024-02-11 using a weekly close confirmation for the pattern. Do not market-chase far above entry without a plan; if price is already >3–4% through entry, wait for a hold/retest.
Exit instructions: EXIT WIN: scale out into $53,123 (first tranche at target; trail remainder above rising 20W EMA if trend continues). EXIT LOSS: flatten or cut adds on a weekly close under invalidation $44,430. TIME EXIT: if neither target nor stop by ~13 weeks, reassess — reduce if structure weakens.
When to add: Add on a retest of the breakout line that holds on a weekly close.
Risk / targets: Hard invalidation / exit: weekly close below $44,430 (-8.0% from entry). First take-profit / reduce zone: $53,123 (+10.0% from entry, ~1.2R). Horizon ~13 weeks unless stopped/target hit sooner.
Size: Size: starter 25–40% of intended BTC sleeve add; leave room to add once. Prefer spot/IBIT. Options/leverage only if portfolio regime already allows heavier risk/calls.
Action: HISTORICAL PLAN (not a live order): on 2024-02-11 the play was buy near $48,294, invalidation $44,430, target/exit $53,123. Outcome: WIN.
If it fails: At the time, a weekly close under $44,430 meant exit/no add.
Flat resistance near $44,885 with 8 touches and rising-lows slope about 46.7% over the 20-week window.
Evidence
Resistance $44,885
Touches 8
High-band width 10.8%
Breakout yes
Extra notes
Best trigger is weekly close above resistance with expanding volume.
If near resistance, wait for close/hold rather than front-running a failed breakout.
Retest of broken resistance is preferred add zone after breakout.
Invalidation: Weekly close below rising-lows trend / 20W EMA, or failed breakout back under $44,885.
Trade plan used: Buy the pullback in an uptrend: staged long BTC/IBIT into the 20-week EMA zone.
What trade: Buy the pullback in an uptrend: staged long BTC/IBIT into the 20-week EMA zone.
When to put it on: When weekly price tags/holds the 20W EMA around the 2024-01-28 signal and the broader uptrend filter is still on (price and 20W EMA above the slower weekly average).
Entry instructions: ENTRY: buy near $42,036 on/after 2024-01-28 using a weekly close confirmation for the pattern. Do not market-chase far above entry without a plan; if price is already >3–4% through entry, wait for a hold/retest.
Exit instructions: EXIT WIN: scale out into $46,239 (first tranche at target; trail remainder above rising 20W EMA if trend continues). EXIT LOSS: flatten or cut adds on a weekly close under invalidation $38,522. TIME EXIT: if neither target nor stop by ~13 weeks, reassess — reduce if structure weakens.
When to add: Add on the first weekly close back above the 20W EMA after the touch, not while still slicing lower through it.
Risk / targets: Hard invalidation / exit: weekly close below $38,522 (-8.4% from entry). First take-profit / reduce zone: $46,239 (+10.0% from entry, ~1.2R). Horizon ~13 weeks unless stopped/target hit sooner.
Size: Size: starter 25–40% of intended BTC sleeve add; leave room to add once. Prefer spot/IBIT. Options/leverage only if portfolio regime already allows heavier risk/calls.
Action: HISTORICAL PLAN (not a live order): on 2024-01-28 the play was buy near $42,036, invalidation $38,522, target/exit $46,239. Outcome: WIN.
If it fails: At the time, a weekly close under $38,522 meant exit/no add.
BTC is 11.5% from the 20-week EMA after a recent EMA-zone touch; weekly trend filter is on.
Evidence
Close $42,036 vs 20W EMA $37,688
26-week return 43.6%
20W EMA above 40W SMA
Extra notes
If already exposed: constructive add/hold zone while closes defend the 20W EMA.
Fresh long: stage, do not max-buy; prefer confirmation above this week's high or a green weekly close.
Avoid leverage if weekly close loses the 20W EMA and MACD histogram deteriorates.
Invalidation: Weekly close below 20W EMA / prior swing low zone ($37,688)
Trade plan used: Buy the cup-and-handle pivot breakout: smaller staged long until confirmed.
What trade: Buy the cup-and-handle pivot breakout: smaller staged long until confirmed.
When to put it on: Enter on a weekly close above the pivot ($45,976). If only the handle is forming around 2024-01-14, wait for the breakout close rather than guessing the bottom of the handle.
Entry instructions: ENTRY: buy near $41,796 on/after 2024-01-14 using a weekly close confirmation for the pattern. Do not market-chase far above entry without a plan; if price is already >3–4% through entry, wait for a hold/retest.
Exit instructions: EXIT WIN: scale out into $45,976 (first tranche at target; trail remainder above rising 20W EMA if trend continues). EXIT LOSS: flatten or cut adds on a weekly close under invalidation $34,083. TIME EXIT: if neither target nor stop by ~13 weeks, reassess — reduce if structure weakens.
When to add: Add only after the breakout holds for a full weekly close and the handle low stays intact.
Risk / targets: Hard invalidation / exit: weekly close below $34,083 (-18.5% from entry). First take-profit / reduce zone: $45,976 (+10.0% from entry, ~0.5R). Horizon ~13 weeks unless stopped/target hit sooner.
Size: Size: starter 25–40% of intended BTC sleeve add; leave room to add once. Prefer spot/IBIT. Options/leverage only if portfolio regime already allows heavier risk/calls.
Action: HISTORICAL PLAN (not a live order): on 2024-01-14 the play was buy near $41,796, invalidation $34,083, target/exit $45,976. Outcome: WIN.
If it fails: At the time, a weekly close under $34,083 meant exit/no add.
Potential rounded base: cup depth 37.9%, recovery to 42.9% from left rim, handle depth 5.1%; pivot near $35,920.
Evidence
Left rim $25,136
Cup low $15,599
Right rim $35,920
Pivot $35,920
Breakout yes
Extra notes
Treat as lower-confidence algorithmic pattern until visually confirmed on TradingView weekly candles.
Trigger is weekly close above pivot; handle should stay orderly and above 20W EMA.
Size smaller than EMA/MACD signals unless breakout volume confirms.
Invalidation: Handle low violation ($34,083) or weekly close back below pivot after breakout.
Trade plan used: Buy the cup-and-handle pivot breakout: smaller staged long until confirmed.
What trade: Buy the cup-and-handle pivot breakout: smaller staged long until confirmed.
When to put it on: Enter on a weekly close above the pivot ($41,125). If only the handle is forming around 2023-11-19, wait for the breakout close rather than guessing the bottom of the handle.
Entry instructions: ENTRY: buy near $37,387 on/after 2023-11-19 using a weekly close confirmation for the pattern. Do not market-chase far above entry without a plan; if price is already >3–4% through entry, wait for a hold/retest.
Exit instructions: EXIT WIN: scale out into $41,125 (first tranche at target; trail remainder above rising 20W EMA if trend continues). EXIT LOSS: flatten or cut adds on a weekly close under invalidation $24,930. TIME EXIT: if neither target nor stop by ~13 weeks, reassess — reduce if structure weakens.
When to add: Add only after the breakout holds for a full weekly close and the handle low stays intact.
Risk / targets: Hard invalidation / exit: weekly close below $24,930 (-33.3% from entry). First take-profit / reduce zone: $41,125 (+10.0% from entry, ~0.3R). Horizon ~13 weeks unless stopped/target hit sooner.
Size: Size: starter 25–40% of intended BTC sleeve add; leave room to add once. Prefer spot/IBIT. Options/leverage only if portfolio regime already allows heavier risk/calls.
Action: HISTORICAL PLAN (not a live order): on 2023-11-19 the play was buy near $37,387, invalidation $24,930, target/exit $41,125. Outcome: WIN.
If it fails: At the time, a weekly close under $24,930 meant exit/no add.
Potential rounded base: cup depth 54.4%, recovery to -7.0% from left rim, handle depth 21.6%; pivot near $34,222.
Evidence
Left rim $34,222
Cup low $15,599
Right rim $31,815
Pivot $34,222
Breakout yes
Extra notes
Treat as lower-confidence algorithmic pattern until visually confirmed on TradingView weekly candles.
Trigger is weekly close above pivot; handle should stay orderly and above 20W EMA.
Size smaller than EMA/MACD signals unless breakout volume confirms.
Invalidation: Handle low violation ($24,930) or weekly close back below pivot after breakout.
Trade plan used: Buy the neckline breakout: staged long BTC/IBIT after confirmation.
What trade: Buy the neckline breakout: staged long BTC/IBIT after confirmation.
When to put it on: Enter on a weekly close above the neckline/target ($40,760). Use 2023-11-12 as the pattern-alert date; require the close, not just a wick.
Entry instructions: ENTRY: buy near $37,055 on/after 2023-11-12 using a weekly close confirmation for the pattern. Do not market-chase far above entry without a plan; if price is already >3–4% through entry, wait for a hold/retest.
Exit instructions: EXIT WIN: scale out into $40,760 (first tranche at target; trail remainder above rising 20W EMA if trend continues). EXIT LOSS: flatten or cut adds on a weekly close under invalidation $19,628. TIME EXIT: if neither target nor stop by ~13 weeks, reassess — reduce if structure weakens.
When to add: Add on a neckline retest that holds on a weekly close.
Risk / targets: Hard invalidation / exit: weekly close below $19,628 (-47.0% from entry). First take-profit / reduce zone: $40,760 (+10.0% from entry, ~0.2R). Horizon ~13 weeks unless stopped/target hit sooner.
Size: Size: starter 25–40% of intended BTC sleeve add; leave room to add once. Prefer spot/IBIT. Options/leverage only if portfolio regime already allows heavier risk/calls.
Action: HISTORICAL PLAN (not a live order): on 2023-11-12 the play was buy near $37,055, invalidation $19,628, target/exit $40,760. Outcome: WIN.
If it fails: At the time, a weekly close under $19,628 meant exit/no add.
Potential neckline near $23,291; breakout filter met/near.
Evidence
Left shoulder $18,290
Head $15,599
Right shoulder $19,628
Neckline $23,291
Extra notes
Algorithmic I-H&S needs visual confirmation; use TradingView weekly chart before sizing.
Trigger is weekly close above neckline; retest hold is preferred add.
If right shoulder fails, stand down.
Invalidation: Weekly close below right-shoulder low ($19,628) or failed neckline reclaim.
Trade plan used: Buy a small staged long in BTC or IBIT (spot first; no leverage unless portfolio regime is already risk-on).
What trade: Buy a small staged long in BTC or IBIT (spot first; no leverage unless portfolio regime is already risk-on).
When to put it on: On/after the weekly close that printed the MACD bullish cross (2023-10-29). Best if price is reclaiming or holding above the 20-week EMA; if still below a falling 20W EMA, wait for a weekly close back above it before sizing up.
Entry instructions: ENTRY: buy near $34,538 on/after 2023-10-29 using a weekly close confirmation for the pattern. Do not market-chase far above entry without a plan; if price is already >3–4% through entry, wait for a hold/retest.
Exit instructions: EXIT WIN: scale out into $37,992 (first tranche at target; trail remainder above rising 20W EMA if trend continues). EXIT LOSS: flatten or cut adds on a weekly close under invalidation $31,775. TIME EXIT: if neither target nor stop by ~13 weeks, reassess — reduce if structure weakens.
When to add: Add only on a green weekly close that keeps MACD above signal, or on a shallow retest that holds the 20W EMA.
Risk / targets: Hard invalidation / exit: weekly close below $31,775 (-8.0% from entry). First take-profit / reduce zone: $37,992 (+10.0% from entry, ~1.3R). Horizon ~13 weeks unless stopped/target hit sooner.
Size: Size: starter 25–40% of intended BTC sleeve add; leave room to add once. Prefer spot/IBIT. Options/leverage only if portfolio regime already allows heavier risk/calls.
Action: HISTORICAL PLAN (not a live order): on 2023-10-29 the play was buy near $34,538, invalidation $31,775, target/exit $37,992. Outcome: WIN.
If it fails: At the time, a weekly close under $31,775 meant exit/no add.
Weekly MACD line is 925 vs signal 566; histogram 358.
Evidence
MACD 925
Signal 566
Histogram 358
Prior histogram -61
Extra notes
Bullish momentum inflection; best when price is above/rising 20W EMA.
Use as confirmation for staged spot/IBIT exposure rather than a standalone all-in trigger.
If cross occurs below a falling 20W EMA, downgrade to watchlist-only.
Invalidation: MACD line rolls back below signal on weekly close or histogram flips materially negative.
Trade plan used: Buy strength on the flag breakout: staged long BTC/IBIT.
What trade: Buy strength on the flag breakout: staged long BTC/IBIT.
When to put it on: Prefer entry on a weekly close through flag resistance near $31,815, not mid-flag. The 2023-10-22 signal marks the setup window.
Entry instructions: ENTRY: buy near $29,994 on/after 2023-10-22 using a weekly close confirmation for the pattern. Do not market-chase far above entry without a plan; if price is already >3–4% through entry, wait for a hold/retest.
Exit instructions: EXIT WIN: scale out into $31,815 (first tranche at target; trail remainder above rising 20W EMA if trend continues). EXIT LOSS: flatten or cut adds on a weekly close under invalidation $24,930. TIME EXIT: if neither target nor stop by ~13 weeks, reassess — reduce if structure weakens.
When to add: Add on a successful retest of broken flag resistance that holds as support.
Risk / targets: Hard invalidation / exit: weekly close below $24,930 (-16.9% from entry). First take-profit / reduce zone: $31,815 (+6.1% from entry, ~0.4R). Horizon ~13 weeks unless stopped/target hit sooner.
Size: Size: starter 25–40% of intended BTC sleeve add; leave room to add once. Prefer spot/IBIT. Options/leverage only if portfolio regime already allows heavier risk/calls.
Action: HISTORICAL PLAN (not a live order): on 2023-10-22 the play was buy near $29,994, invalidation $24,930, target/exit $31,815. Outcome: WIN.
If it fails: At the time, a weekly close under $24,930 meant exit/no add.
Prior 8-week thrust max 30.5% followed by 8-week consolidation range 21.5%; breakout filter not met.
Evidence
8W base high $30,287
8W base low $24,930
Base drift 15.5%
Volume cool-down no
Extra notes
A weekly close through flag resistance supports adding strength.
If still inside flag, wait for breakout; avoid buying middle of range unless this overlaps 20W EMA support.
Target is measured-move/ATH zone, but trail risk below flag low.
Invalidation: Weekly close below flag low/support ($24,930)
Trade plan used: Buy the pullback in an uptrend: staged long BTC/IBIT into the 20-week EMA zone.
What trade: Buy the pullback in an uptrend: staged long BTC/IBIT into the 20-week EMA zone.
When to put it on: When weekly price tags/holds the 20W EMA around the 2023-10-22 signal and the broader uptrend filter is still on (price and 20W EMA above the slower weekly average).
Entry instructions: ENTRY: buy near $29,994 on/after 2023-10-22 using a weekly close confirmation for the pattern. Do not market-chase far above entry without a plan; if price is already >3–4% through entry, wait for a hold/retest.
Exit instructions: EXIT WIN: scale out into $32,993 (first tranche at target; trail remainder above rising 20W EMA if trend continues). EXIT LOSS: flatten or cut adds on a weekly close under invalidation $27,581. TIME EXIT: if neither target nor stop by ~13 weeks, reassess — reduce if structure weakens.
When to add: Add on the first weekly close back above the 20W EMA after the touch, not while still slicing lower through it.
Risk / targets: Hard invalidation / exit: weekly close below $27,581 (-8.0% from entry). First take-profit / reduce zone: $32,993 (+10.0% from entry, ~1.2R). Horizon ~13 weeks unless stopped/target hit sooner.
Size: Size: starter 25–40% of intended BTC sleeve add; leave room to add once. Prefer spot/IBIT. Options/leverage only if portfolio regime already allows heavier risk/calls.
Action: HISTORICAL PLAN (not a live order): on 2023-10-22 the play was buy near $29,994, invalidation $27,581, target/exit $32,993. Outcome: WIN.
If it fails: At the time, a weekly close under $27,581 meant exit/no add.
BTC is 8.7% from the 20-week EMA after a recent EMA-zone touch; weekly trend filter is on.
Evidence
Close $29,994 vs 20W EMA $27,581
26-week return 8.7%
20W EMA above 40W SMA
Extra notes
If already exposed: constructive add/hold zone while closes defend the 20W EMA.
Fresh long: stage, do not max-buy; prefer confirmation above this week's high or a green weekly close.
Avoid leverage if weekly close loses the 20W EMA and MACD histogram deteriorates.
Invalidation: Weekly close below 20W EMA / prior swing low zone ($24,930)
Trade plan used: Buy the neckline breakout: staged long BTC/IBIT after confirmation.
What trade: Buy the neckline breakout: staged long BTC/IBIT after confirmation.
When to put it on: Enter on a weekly close above the neckline/target ($29,188). Use 2023-09-17 as the pattern-alert date; require the close, not just a wick.
Entry instructions: ENTRY: buy near $26,534 on/after 2023-09-17 using a weekly close confirmation for the pattern. Do not market-chase far above entry without a plan; if price is already >3–4% through entry, wait for a hold/retest.
Exit instructions: EXIT WIN: scale out into $29,188 (first tranche at target; trail remainder above rising 20W EMA if trend continues). EXIT LOSS: flatten or cut adds on a weekly close under invalidation $19,628. TIME EXIT: if neither target nor stop by ~13 weeks, reassess — reduce if structure weakens.
When to add: Add on a neckline retest that holds on a weekly close.
Risk / targets: Hard invalidation / exit: weekly close below $19,628 (-26.0% from entry). First take-profit / reduce zone: $29,188 (+10.0% from entry, ~0.4R). Horizon ~13 weeks unless stopped/target hit sooner.
Size: Size: starter 25–40% of intended BTC sleeve add; leave room to add once. Prefer spot/IBIT. Options/leverage only if portfolio regime already allows heavier risk/calls.
Action: HISTORICAL PLAN (not a live order): on 2023-09-17 the play was buy near $26,534, invalidation $19,628, target/exit $29,188. Outcome: WIN.
If it fails: At the time, a weekly close under $19,628 meant exit/no add.
Potential neckline near $23,291; breakout filter met/near.
Evidence
Left shoulder $18,290
Head $15,599
Right shoulder $19,628
Neckline $23,291
Extra notes
Algorithmic I-H&S needs visual confirmation; use TradingView weekly chart before sizing.
Trigger is weekly close above neckline; retest hold is preferred add.
If right shoulder fails, stand down.
Invalidation: Weekly close below right-shoulder low ($19,628) or failed neckline reclaim.
Trade plan used: Buy the pullback in an uptrend: staged long BTC/IBIT into the 20-week EMA zone.
What trade: Buy the pullback in an uptrend: staged long BTC/IBIT into the 20-week EMA zone.
When to put it on: When weekly price tags/holds the 20W EMA around the 2023-08-13 signal and the broader uptrend filter is still on (price and 20W EMA above the slower weekly average).
Entry instructions: ENTRY: buy near $29,283 on/after 2023-08-13 using a weekly close confirmation for the pattern. Do not market-chase far above entry without a plan; if price is already >3–4% through entry, wait for a hold/retest.
Exit instructions: EXIT WIN: scale out into $32,211 (first tranche at target; trail remainder above rising 20W EMA if trend continues). EXIT LOSS: flatten or cut adds on a weekly close under invalidation $28,074. TIME EXIT: if neither target nor stop by ~13 weeks, reassess — reduce if structure weakens.
When to add: Add on the first weekly close back above the 20W EMA after the touch, not while still slicing lower through it.
Risk / targets: Hard invalidation / exit: weekly close below $28,074 (-4.1% from entry). First take-profit / reduce zone: $32,211 (+10.0% from entry, ~2.4R). Horizon ~13 weeks unless stopped/target hit sooner.
Size: Size: starter 25–40% of intended BTC sleeve add; leave room to add once. Prefer spot/IBIT. Options/leverage only if portfolio regime already allows heavier risk/calls.
Action: HISTORICAL PLAN (not a live order): on 2023-08-13 the play was buy near $29,283, invalidation $28,074, target/exit $32,211. Outcome: LOSS.
If it fails: At the time, a weekly close under $28,074 meant exit/no add.
BTC is 4.3% from the 20-week EMA after a recent EMA-zone touch; weekly trend filter is on.
Evidence
Close $29,283 vs 20W EMA $28,074
26-week return 34.4%
20W EMA above 40W SMA
Extra notes
If already exposed: constructive add/hold zone while closes defend the 20W EMA.
Fresh long: stage, do not max-buy; prefer confirmation above this week's high or a green weekly close.
Avoid leverage if weekly close loses the 20W EMA and MACD histogram deteriorates.
Invalidation: Weekly close below 20W EMA / prior swing low zone ($26,313)
Trade plan used: Buy the neckline breakout: staged long BTC/IBIT after confirmation.
What trade: Buy the neckline breakout: staged long BTC/IBIT after confirmation.
When to put it on: Enter on a weekly close above the neckline/target ($33,093). Use 2023-07-23 as the pattern-alert date; require the close, not just a wick.
Entry instructions: ENTRY: buy near $30,085 on/after 2023-07-23 using a weekly close confirmation for the pattern. Do not market-chase far above entry without a plan; if price is already >3–4% through entry, wait for a hold/retest.
Exit instructions: EXIT WIN: scale out into $33,093 (first tranche at target; trail remainder above rising 20W EMA if trend continues). EXIT LOSS: flatten or cut adds on a weekly close under invalidation $19,628. TIME EXIT: if neither target nor stop by ~13 weeks, reassess — reduce if structure weakens.
When to add: Add on a neckline retest that holds on a weekly close.
Risk / targets: Hard invalidation / exit: weekly close below $19,628 (-34.8% from entry). First take-profit / reduce zone: $33,093 (+10.0% from entry, ~0.3R). Horizon ~13 weeks unless stopped/target hit sooner.
Size: Size: starter 25–40% of intended BTC sleeve add; leave room to add once. Prefer spot/IBIT. Options/leverage only if portfolio regime already allows heavier risk/calls.
Action: HISTORICAL PLAN (not a live order): on 2023-07-23 the play was buy near $30,085, invalidation $19,628, target/exit $33,093. Outcome: LOSS.
If it fails: At the time, a weekly close under $19,628 meant exit/no add.
Potential neckline near $23,291; breakout filter met/near.
Evidence
Left shoulder $18,290
Head $15,599
Right shoulder $19,628
Neckline $23,291
Extra notes
Algorithmic I-H&S needs visual confirmation; use TradingView weekly chart before sizing.
Trigger is weekly close above neckline; retest hold is preferred add.
If right shoulder fails, stand down.
Invalidation: Weekly close below right-shoulder low ($19,628) or failed neckline reclaim.
Outcome reason: time stop @ horizon (close vs entry)
Trade plan used: Buy a small staged long in BTC or IBIT (spot first; no leverage unless portfolio regime is already risk-on).
What trade: Buy a small staged long in BTC or IBIT (spot first; no leverage unless portfolio regime is already risk-on).
When to put it on: On/after the weekly close that printed the MACD bullish cross (2023-07-02). Best if price is reclaiming or holding above the 20-week EMA; if still below a falling 20W EMA, wait for a weekly close back above it before sizing up.
Entry instructions: ENTRY: buy near $30,621 on/after 2023-07-02 using a weekly close confirmation for the pattern. Do not market-chase far above entry without a plan; if price is already >3–4% through entry, wait for a hold/retest.
Exit instructions: EXIT WIN: scale out into $33,683 (first tranche at target; trail remainder above rising 20W EMA if trend continues). EXIT LOSS: flatten or cut adds on a weekly close under invalidation $28,171. TIME EXIT: if neither target nor stop by ~13 weeks, reassess — reduce if structure weakens.
When to add: Add only on a green weekly close that keeps MACD above signal, or on a shallow retest that holds the 20W EMA.
Risk / targets: Hard invalidation / exit: weekly close below $28,171 (-8.0% from entry). First take-profit / reduce zone: $33,683 (+10.0% from entry, ~1.2R). Horizon ~13 weeks unless stopped/target hit sooner.
Size: Size: starter 25–40% of intended BTC sleeve add; leave room to add once. Prefer spot/IBIT. Options/leverage only if portfolio regime already allows heavier risk/calls.
Action: HISTORICAL PLAN (not a live order): on 2023-07-02 the play was buy near $30,621, invalidation $28,171, target/exit $33,683. Outcome: LOSS.
If it fails: At the time, a weekly close under $28,171 meant exit/no add.
Weekly MACD line is 1585 vs signal 1461; histogram 123.
Evidence
MACD 1585
Signal 1461
Histogram 123
Prior histogram -2
Extra notes
Bullish momentum inflection; best when price is above/rising 20W EMA.
Use as confirmation for staged spot/IBIT exposure rather than a standalone all-in trigger.
If cross occurs below a falling 20W EMA, downgrade to watchlist-only.
Invalidation: MACD line rolls back below signal on weekly close or histogram flips materially negative.
Trade plan used: Buy the breakout above flat resistance: staged long BTC/IBIT.
What trade: Buy the breakout above flat resistance: staged long BTC/IBIT.
When to put it on: Enter on a weekly close above triangle resistance/target zone ($33,528), with expanding volume preferred. Treat 2023-06-25 as the alert date; do not front-run a failed poke.
Entry instructions: ENTRY: buy near $30,480 on/after 2023-06-25 using a weekly close confirmation for the pattern. Do not market-chase far above entry without a plan; if price is already >3–4% through entry, wait for a hold/retest.
Exit instructions: EXIT WIN: scale out into $33,528 (first tranche at target; trail remainder above rising 20W EMA if trend continues). EXIT LOSS: flatten or cut adds on a weekly close under invalidation $28,042. TIME EXIT: if neither target nor stop by ~13 weeks, reassess — reduce if structure weakens.
When to add: Add on a retest of the breakout line that holds on a weekly close.
Risk / targets: Hard invalidation / exit: weekly close below $28,042 (-8.0% from entry). First take-profit / reduce zone: $33,528 (+10.0% from entry, ~1.3R). Horizon ~13 weeks unless stopped/target hit sooner.
Size: Size: starter 25–40% of intended BTC sleeve add; leave room to add once. Prefer spot/IBIT. Options/leverage only if portfolio regime already allows heavier risk/calls.
Action: HISTORICAL PLAN (not a live order): on 2023-06-25 the play was buy near $30,480, invalidation $28,042, target/exit $33,528. Outcome: LOSS.
If it fails: At the time, a weekly close under $28,042 meant exit/no add.
Flat resistance near $30,067 with 5 touches and rising-lows slope about 19.7% over the 20-week window.
Evidence
Resistance $30,067
Touches 5
High-band width 7.3%
Breakout yes
Extra notes
Best trigger is weekly close above resistance with expanding volume.
If near resistance, wait for close/hold rather than front-running a failed breakout.
Retest of broken resistance is preferred add zone after breakout.
Invalidation: Weekly close below rising-lows trend / 20W EMA, or failed breakout back under $30,067.
Outcome reason: time stop @ horizon (close vs entry)
Trade plan used: Buy the pullback in an uptrend: staged long BTC/IBIT into the 20-week EMA zone.
What trade: Buy the pullback in an uptrend: staged long BTC/IBIT into the 20-week EMA zone.
When to put it on: When weekly price tags/holds the 20W EMA around the 2023-06-18 signal and the broader uptrend filter is still on (price and 20W EMA above the slower weekly average).
Entry instructions: ENTRY: buy near $26,336 on/after 2023-06-18 using a weekly close confirmation for the pattern. Do not market-chase far above entry without a plan; if price is already >3–4% through entry, wait for a hold/retest.
Exit instructions: EXIT WIN: scale out into $28,970 (first tranche at target; trail remainder above rising 20W EMA if trend continues). EXIT LOSS: flatten or cut adds on a weekly close under invalidation $25,978. TIME EXIT: if neither target nor stop by ~13 weeks, reassess — reduce if structure weakens.
When to add: Add on the first weekly close back above the 20W EMA after the touch, not while still slicing lower through it.
Risk / targets: Hard invalidation / exit: weekly close below $25,978 (-1.4% from entry). First take-profit / reduce zone: $28,970 (+10.0% from entry, ~7.4R). Horizon ~13 weeks unless stopped/target hit sooner.
Size: Size: starter 25–40% of intended BTC sleeve add; leave room to add once. Prefer spot/IBIT. Options/leverage only if portfolio regime already allows heavier risk/calls.
Action: HISTORICAL PLAN (not a live order): on 2023-06-18 the play was buy near $26,336, invalidation $25,978, target/exit $28,970. Outcome: WIN.
If it fails: At the time, a weekly close under $25,978 meant exit/no add.
BTC is 1.4% from the 20-week EMA after a recent EMA-zone touch; weekly trend filter is on.
Evidence
Close $26,336 vs 20W EMA $25,978
26-week return 57.2%
20W EMA above 40W SMA
Extra notes
If already exposed: constructive add/hold zone while closes defend the 20W EMA.
Fresh long: stage, do not max-buy; prefer confirmation above this week's high or a green weekly close.
Avoid leverage if weekly close loses the 20W EMA and MACD histogram deteriorates.
Invalidation: Weekly close below 20W EMA / prior swing low zone ($24,797)
Trade plan used: Buy the neckline breakout: staged long BTC/IBIT after confirmation.
What trade: Buy the neckline breakout: staged long BTC/IBIT after confirmation.
When to put it on: Enter on a weekly close above the neckline/target ($30,894). Use 2023-05-28 as the pattern-alert date; require the close, not just a wick.
Entry instructions: ENTRY: buy near $28,086 on/after 2023-05-28 using a weekly close confirmation for the pattern. Do not market-chase far above entry without a plan; if price is already >3–4% through entry, wait for a hold/retest.
Exit instructions: EXIT WIN: scale out into $30,894 (first tranche at target; trail remainder above rising 20W EMA if trend continues). EXIT LOSS: flatten or cut adds on a weekly close under invalidation $19,628. TIME EXIT: if neither target nor stop by ~13 weeks, reassess — reduce if structure weakens.
When to add: Add on a neckline retest that holds on a weekly close.
Risk / targets: Hard invalidation / exit: weekly close below $19,628 (-30.1% from entry). First take-profit / reduce zone: $30,894 (+10.0% from entry, ~0.3R). Horizon ~13 weeks unless stopped/target hit sooner.
Size: Size: starter 25–40% of intended BTC sleeve add; leave room to add once. Prefer spot/IBIT. Options/leverage only if portfolio regime already allows heavier risk/calls.
Action: HISTORICAL PLAN (not a live order): on 2023-05-28 the play was buy near $28,086, invalidation $19,628, target/exit $30,894. Outcome: WIN.
If it fails: At the time, a weekly close under $19,628 meant exit/no add.
Potential neckline near $23,291; breakout filter met/near.
Evidence
Left shoulder $18,290
Head $15,599
Right shoulder $19,628
Neckline $23,291
Extra notes
Algorithmic I-H&S needs visual confirmation; use TradingView weekly chart before sizing.
Trigger is weekly close above neckline; retest hold is preferred add.
If right shoulder fails, stand down.
Invalidation: Weekly close below right-shoulder low ($19,628) or failed neckline reclaim.
Trade plan used: Buy the pullback in an uptrend: staged long BTC/IBIT into the 20-week EMA zone.
What trade: Buy the pullback in an uptrend: staged long BTC/IBIT into the 20-week EMA zone.
When to put it on: When weekly price tags/holds the 20W EMA around the 2023-04-23 signal and the broader uptrend filter is still on (price and 20W EMA above the slower weekly average).
Entry instructions: ENTRY: buy near $27,591 on/after 2023-04-23 using a weekly close confirmation for the pattern. Do not market-chase far above entry without a plan; if price is already >3–4% through entry, wait for a hold/retest.
Exit instructions: EXIT WIN: scale out into $30,351 (first tranche at target; trail remainder above rising 20W EMA if trend continues). EXIT LOSS: flatten or cut adds on a weekly close under invalidation $24,513. TIME EXIT: if neither target nor stop by ~13 weeks, reassess — reduce if structure weakens.
When to add: Add on the first weekly close back above the 20W EMA after the touch, not while still slicing lower through it.
Risk / targets: Hard invalidation / exit: weekly close below $24,513 (-11.2% from entry). First take-profit / reduce zone: $30,351 (+10.0% from entry, ~0.9R). Horizon ~13 weeks unless stopped/target hit sooner.
Size: Size: starter 25–40% of intended BTC sleeve add; leave room to add once. Prefer spot/IBIT. Options/leverage only if portfolio regime already allows heavier risk/calls.
Action: HISTORICAL PLAN (not a live order): on 2023-04-23 the play was buy near $27,591, invalidation $24,513, target/exit $30,351. Outcome: WIN.
If it fails: At the time, a weekly close under $24,513 meant exit/no add.
BTC is 12.6% from the 20-week EMA after a recent EMA-zone touch; weekly trend filter is on.
Evidence
Close $27,591 vs 20W EMA $24,513
26-week return 41.0%
20W EMA above 40W SMA
Extra notes
If already exposed: constructive add/hold zone while closes defend the 20W EMA.
Fresh long: stage, do not max-buy; prefer confirmation above this week's high or a green weekly close.
Avoid leverage if weekly close loses the 20W EMA and MACD histogram deteriorates.
Invalidation: Weekly close below 20W EMA / prior swing low zone ($19,628)
Trade plan used: Buy the neckline breakout: staged long BTC/IBIT after confirmation.
What trade: Buy the neckline breakout: staged long BTC/IBIT after confirmation.
When to put it on: Enter on a weekly close above the neckline/target ($31,019). Use 2023-04-02 as the pattern-alert date; require the close, not just a wick.
Entry instructions: ENTRY: buy near $28,199 on/after 2023-04-02 using a weekly close confirmation for the pattern. Do not market-chase far above entry without a plan; if price is already >3–4% through entry, wait for a hold/retest.
Exit instructions: EXIT WIN: scale out into $31,019 (first tranche at target; trail remainder above rising 20W EMA if trend continues). EXIT LOSS: flatten or cut adds on a weekly close under invalidation $19,628. TIME EXIT: if neither target nor stop by ~13 weeks, reassess — reduce if structure weakens.
When to add: Add on a neckline retest that holds on a weekly close.
Risk / targets: Hard invalidation / exit: weekly close below $19,628 (-30.4% from entry). First take-profit / reduce zone: $31,019 (+10.0% from entry, ~0.3R). Horizon ~13 weeks unless stopped/target hit sooner.
Size: Size: starter 25–40% of intended BTC sleeve add; leave room to add once. Prefer spot/IBIT. Options/leverage only if portfolio regime already allows heavier risk/calls.
Action: HISTORICAL PLAN (not a live order): on 2023-04-02 the play was buy near $28,199, invalidation $19,628, target/exit $31,019. Outcome: WIN.
If it fails: At the time, a weekly close under $19,628 meant exit/no add.
Potential neckline near $23,291; breakout filter met/near.
Evidence
Left shoulder $18,290
Head $15,599
Right shoulder $19,628
Neckline $23,291
Extra notes
Algorithmic I-H&S needs visual confirmation; use TradingView weekly chart before sizing.
Trigger is weekly close above neckline; retest hold is preferred add.
If right shoulder fails, stand down.
Invalidation: Weekly close below right-shoulder low ($19,628) or failed neckline reclaim.
Trade plan used: Buy the breakout above flat resistance: staged long BTC/IBIT.
What trade: Buy the breakout above flat resistance: staged long BTC/IBIT.
When to put it on: Enter on a weekly close above triangle resistance/target zone ($30,843), with expanding volume preferred. Treat 2023-03-19 as the alert date; do not front-run a failed poke.
Entry instructions: ENTRY: buy near $28,039 on/after 2023-03-19 using a weekly close confirmation for the pattern. Do not market-chase far above entry without a plan; if price is already >3–4% through entry, wait for a hold/retest.
Exit instructions: EXIT WIN: scale out into $30,843 (first tranche at target; trail remainder above rising 20W EMA if trend continues). EXIT LOSS: flatten or cut adds on a weekly close under invalidation $25,796. TIME EXIT: if neither target nor stop by ~13 weeks, reassess — reduce if structure weakens.
When to add: Add on a retest of the breakout line that holds on a weekly close.
Risk / targets: Hard invalidation / exit: weekly close below $25,796 (-8.0% from entry). First take-profit / reduce zone: $30,843 (+10.0% from entry, ~1.3R). Horizon ~13 weeks unless stopped/target hit sooner.
Size: Size: starter 25–40% of intended BTC sleeve add; leave room to add once. Prefer spot/IBIT. Options/leverage only if portfolio regime already allows heavier risk/calls.
Action: HISTORICAL PLAN (not a live order): on 2023-03-19 the play was buy near $28,039, invalidation $25,796, target/exit $30,843. Outcome: WIN.
If it fails: At the time, a weekly close under $25,796 meant exit/no add.
Flat resistance near $24,311 with 6 touches and rising-lows slope about 35.7% over the 20-week window.
Evidence
Resistance $24,311
Touches 6
High-band width 7.6%
Breakout yes
Extra notes
Best trigger is weekly close above resistance with expanding volume.
If near resistance, wait for close/hold rather than front-running a failed breakout.
Retest of broken resistance is preferred add zone after breakout.
Invalidation: Weekly close below rising-lows trend / 20W EMA, or failed breakout back under $24,311.
Trade plan used: Buy the pullback in an uptrend: staged long BTC/IBIT into the 20-week EMA zone.
What trade: Buy the pullback in an uptrend: staged long BTC/IBIT into the 20-week EMA zone.
When to put it on: When weekly price tags/holds the 20W EMA around the 2023-02-26 signal and the broader uptrend filter is still on (price and 20W EMA above the slower weekly average).
Entry instructions: ENTRY: buy near $23,561 on/after 2023-02-26 using a weekly close confirmation for the pattern. Do not market-chase far above entry without a plan; if price is already >3–4% through entry, wait for a hold/retest.
Exit instructions: EXIT WIN: scale out into $25,917 (first tranche at target; trail remainder above rising 20W EMA if trend continues). EXIT LOSS: flatten or cut adds on a weekly close under invalidation $21,048. TIME EXIT: if neither target nor stop by ~13 weeks, reassess — reduce if structure weakens.
When to add: Add on the first weekly close back above the 20W EMA after the touch, not while still slicing lower through it.
Risk / targets: Hard invalidation / exit: weekly close below $21,048 (-10.7% from entry). First take-profit / reduce zone: $25,917 (+10.0% from entry, ~0.9R). Horizon ~13 weeks unless stopped/target hit sooner.
Size: Size: starter 25–40% of intended BTC sleeve add; leave room to add once. Prefer spot/IBIT. Options/leverage only if portfolio regime already allows heavier risk/calls.
Action: HISTORICAL PLAN (not a live order): on 2023-02-26 the play was buy near $23,561, invalidation $21,048, target/exit $25,917. Outcome: LOSS.
If it fails: At the time, a weekly close under $21,048 meant exit/no add.
BTC is 11.9% from the 20-week EMA after a recent EMA-zone touch; weekly trend filter is on.
Evidence
Close $23,561 vs 20W EMA $21,048
26-week return 20.1%
20W EMA above 40W SMA
Extra notes
If already exposed: constructive add/hold zone while closes defend the 20W EMA.
Fresh long: stage, do not max-buy; prefer confirmation above this week's high or a green weekly close.
Avoid leverage if weekly close loses the 20W EMA and MACD histogram deteriorates.
Invalidation: Weekly close below 20W EMA / prior swing low zone ($16,572)
Trade plan used: Buy a small staged long in BTC or IBIT (spot first; no leverage unless portfolio regime is already risk-on).
What trade: Buy a small staged long in BTC or IBIT (spot first; no leverage unless portfolio regime is already risk-on).
When to put it on: On/after the weekly close that printed the MACD bullish cross (2022-08-14). Best if price is reclaiming or holding above the 20-week EMA; if still below a falling 20W EMA, wait for a weekly close back above it before sizing up.
Entry instructions: ENTRY: buy near $24,319 on/after 2022-08-14 using a weekly close confirmation for the pattern. Do not market-chase far above entry without a plan; if price is already >3–4% through entry, wait for a hold/retest.
Exit instructions: EXIT WIN: scale out into $26,751 (first tranche at target; trail remainder above rising 20W EMA if trend continues). EXIT LOSS: flatten or cut adds on a weekly close under invalidation $22,374. TIME EXIT: if neither target nor stop by ~13 weeks, reassess — reduce if structure weakens.
When to add: Add only on a green weekly close that keeps MACD above signal, or on a shallow retest that holds the 20W EMA.
Risk / targets: Hard invalidation / exit: weekly close below $22,374 (-8.0% from entry). First take-profit / reduce zone: $26,751 (+10.0% from entry, ~1.3R). Horizon ~13 weeks unless stopped/target hit sooner.
Size: Size: starter 25–40% of intended BTC sleeve add; leave room to add once. Prefer spot/IBIT. Options/leverage only if portfolio regime already allows heavier risk/calls.
Action: HISTORICAL PLAN (not a live order): on 2022-08-14 the play was buy near $24,319, invalidation $22,374, target/exit $26,751. Outcome: LOSS.
If it fails: At the time, a weekly close under $22,374 meant exit/no add.
Weekly MACD line is -5279 vs signal -5431; histogram 152.
Evidence
MACD -5279
Signal -5431
Histogram 152
Prior histogram -167
Extra notes
Bullish momentum inflection; best when price is above/rising 20W EMA.
Use as confirmation for staged spot/IBIT exposure rather than a standalone all-in trigger.
If cross occurs below a falling 20W EMA, downgrade to watchlist-only.
Invalidation: MACD line rolls back below signal on weekly close or histogram flips materially negative.
Trade plan used: Buy a small staged long in BTC or IBIT (spot first; no leverage unless portfolio regime is already risk-on).
What trade: Buy a small staged long in BTC or IBIT (spot first; no leverage unless portfolio regime is already risk-on).
When to put it on: On/after the weekly close that printed the MACD bullish cross (2022-04-03). Best if price is reclaiming or holding above the 20-week EMA; if still below a falling 20W EMA, wait for a weekly close back above it before sizing up.
Entry instructions: ENTRY: buy near $46,454 on/after 2022-04-03 using a weekly close confirmation for the pattern. Do not market-chase far above entry without a plan; if price is already >3–4% through entry, wait for a hold/retest.
Exit instructions: EXIT WIN: scale out into $51,099 (first tranche at target; trail remainder above rising 20W EMA if trend continues). EXIT LOSS: flatten or cut adds on a weekly close under invalidation $42,737. TIME EXIT: if neither target nor stop by ~13 weeks, reassess — reduce if structure weakens.
When to add: Add only on a green weekly close that keeps MACD above signal, or on a shallow retest that holds the 20W EMA.
Risk / targets: Hard invalidation / exit: weekly close below $42,737 (-8.0% from entry). First take-profit / reduce zone: $51,099 (+10.0% from entry, ~1.2R). Horizon ~13 weeks unless stopped/target hit sooner.
Size: Size: starter 25–40% of intended BTC sleeve add; leave room to add once. Prefer spot/IBIT. Options/leverage only if portfolio regime already allows heavier risk/calls.
Action: HISTORICAL PLAN (not a live order): on 2022-04-03 the play was buy near $46,454, invalidation $42,737, target/exit $51,099. Outcome: LOSS.
If it fails: At the time, a weekly close under $42,737 meant exit/no add.
Weekly MACD line is -1614 vs signal -1831; histogram 217.
Evidence
MACD -1614
Signal -1831
Histogram 217
Prior histogram -212
Extra notes
Bullish momentum inflection; best when price is above/rising 20W EMA.
Use as confirmation for staged spot/IBIT exposure rather than a standalone all-in trigger.
If cross occurs below a falling 20W EMA, downgrade to watchlist-only.
Invalidation: MACD line rolls back below signal on weekly close or histogram flips materially negative.
Trade plan used: Buy the pullback in an uptrend: staged long BTC/IBIT into the 20-week EMA zone.
What trade: Buy the pullback in an uptrend: staged long BTC/IBIT into the 20-week EMA zone.
When to put it on: When weekly price tags/holds the 20W EMA around the 2021-10-17 signal and the broader uptrend filter is still on (price and 20W EMA above the slower weekly average).
Entry instructions: ENTRY: buy near $61,554 on/after 2021-10-17 using a weekly close confirmation for the pattern. Do not market-chase far above entry without a plan; if price is already >3–4% through entry, wait for a hold/retest.
Exit instructions: EXIT WIN: scale out into $67,709 (first tranche at target; trail remainder above rising 20W EMA if trend continues). EXIT LOSS: flatten or cut adds on a weekly close under invalidation $46,675. TIME EXIT: if neither target nor stop by ~13 weeks, reassess — reduce if structure weakens.
When to add: Add on the first weekly close back above the 20W EMA after the touch, not while still slicing lower through it.
Risk / targets: Hard invalidation / exit: weekly close below $46,675 (-24.2% from entry). First take-profit / reduce zone: $67,709 (+10.0% from entry, ~0.4R). Horizon ~13 weeks unless stopped/target hit sooner.
Size: Size: starter 25–40% of intended BTC sleeve add; leave room to add once. Prefer spot/IBIT. Options/leverage only if portfolio regime already allows heavier risk/calls.
Action: HISTORICAL PLAN (not a live order): on 2021-10-17 the play was buy near $61,554, invalidation $46,675, target/exit $67,709. Outcome: WIN.
If it fails: At the time, a weekly close under $46,675 meant exit/no add.
BTC is 31.9% from the 20-week EMA after a recent EMA-zone touch; weekly trend filter is on.
Evidence
Close $61,554 vs 20W EMA $46,675
26-week return 9.5%
20W EMA above 40W SMA
Extra notes
If already exposed: constructive add/hold zone while closes defend the 20W EMA.
Fresh long: stage, do not max-buy; prefer confirmation above this week's high or a green weekly close.
Avoid leverage if weekly close loses the 20W EMA and MACD histogram deteriorates.
Invalidation: Weekly close below 20W EMA / prior swing low zone ($39,788)
Trade plan used: Buy a small staged long in BTC or IBIT (spot first; no leverage unless portfolio regime is already risk-on).
What trade: Buy a small staged long in BTC or IBIT (spot first; no leverage unless portfolio regime is already risk-on).
When to put it on: On/after the weekly close that printed the MACD bullish cross (2021-08-22). Best if price is reclaiming or holding above the 20-week EMA; if still below a falling 20W EMA, wait for a weekly close back above it before sizing up.
Entry instructions: ENTRY: buy near $49,322 on/after 2021-08-22 using a weekly close confirmation for the pattern. Do not market-chase far above entry without a plan; if price is already >3–4% through entry, wait for a hold/retest.
Exit instructions: EXIT WIN: scale out into $54,254 (first tranche at target; trail remainder above rising 20W EMA if trend continues). EXIT LOSS: flatten or cut adds on a weekly close under invalidation $45,376. TIME EXIT: if neither target nor stop by ~13 weeks, reassess — reduce if structure weakens.
When to add: Add only on a green weekly close that keeps MACD above signal, or on a shallow retest that holds the 20W EMA.
Risk / targets: Hard invalidation / exit: weekly close below $45,376 (-8.0% from entry). First take-profit / reduce zone: $54,254 (+10.0% from entry, ~1.2R). Horizon ~13 weeks unless stopped/target hit sooner.
Size: Size: starter 25–40% of intended BTC sleeve add; leave room to add once. Prefer spot/IBIT. Options/leverage only if portfolio regime already allows heavier risk/calls.
Action: HISTORICAL PLAN (not a live order): on 2021-08-22 the play was buy near $49,322, invalidation $45,376, target/exit $54,254. Outcome: LOSS.
If it fails: At the time, a weekly close under $45,376 meant exit/no add.
Weekly MACD line is 1093 vs signal 820; histogram 273.
Evidence
MACD 1093
Signal 820
Histogram 273
Prior histogram -341
Extra notes
Bullish momentum inflection; best when price is above/rising 20W EMA.
Use as confirmation for staged spot/IBIT exposure rather than a standalone all-in trigger.
If cross occurs below a falling 20W EMA, downgrade to watchlist-only.
Invalidation: MACD line rolls back below signal on weekly close or histogram flips materially negative.
Trade plan used: Buy the pullback in an uptrend: staged long BTC/IBIT into the 20-week EMA zone.
What trade: Buy the pullback in an uptrend: staged long BTC/IBIT into the 20-week EMA zone.
When to put it on: When weekly price tags/holds the 20W EMA around the 2021-08-01 signal and the broader uptrend filter is still on (price and 20W EMA above the slower weekly average).
Entry instructions: ENTRY: buy near $39,975 on/after 2021-08-01 using a weekly close confirmation for the pattern. Do not market-chase far above entry without a plan; if price is already >3–4% through entry, wait for a hold/retest.
Exit instructions: EXIT WIN: scale out into $43,972 (first tranche at target; trail remainder above rising 20W EMA if trend continues). EXIT LOSS: flatten or cut adds on a weekly close under invalidation $39,502. TIME EXIT: if neither target nor stop by ~13 weeks, reassess — reduce if structure weakens.
When to add: Add on the first weekly close back above the 20W EMA after the touch, not while still slicing lower through it.
Risk / targets: Hard invalidation / exit: weekly close below $39,502 (-1.2% from entry). First take-profit / reduce zone: $43,972 (+10.0% from entry, ~8.5R). Horizon ~13 weeks unless stopped/target hit sooner.
Size: Size: starter 25–40% of intended BTC sleeve add; leave room to add once. Prefer spot/IBIT. Options/leverage only if portfolio regime already allows heavier risk/calls.
Action: HISTORICAL PLAN (not a live order): on 2021-08-01 the play was buy near $39,975, invalidation $39,502, target/exit $43,972. Outcome: LOSS.
If it fails: At the time, a weekly close under $39,502 meant exit/no add.
BTC is 1.2% from the 20-week EMA after a recent EMA-zone touch; weekly trend filter is on.
Evidence
Close $39,975 vs 20W EMA $39,502
26-week return 20.7%
20W EMA above 40W SMA
Extra notes
If already exposed: constructive add/hold zone while closes defend the 20W EMA.
Fresh long: stage, do not max-buy; prefer confirmation above this week's high or a green weekly close.
Avoid leverage if weekly close loses the 20W EMA and MACD histogram deteriorates.
Invalidation: Weekly close below 20W EMA / prior swing low zone ($28,894)
Trade plan used: Buy the pullback in an uptrend: staged long BTC/IBIT into the 20-week EMA zone.
What trade: Buy the pullback in an uptrend: staged long BTC/IBIT into the 20-week EMA zone.
When to put it on: When weekly price tags/holds the 20W EMA around the 2021-05-16 signal and the broader uptrend filter is still on (price and 20W EMA above the slower weekly average).
Entry instructions: ENTRY: buy near $46,456 on/after 2021-05-16 using a weekly close confirmation for the pattern. Do not market-chase far above entry without a plan; if price is already >3–4% through entry, wait for a hold/retest.
Exit instructions: EXIT WIN: scale out into $51,102 (first tranche at target; trail remainder above rising 20W EMA if trend continues). EXIT LOSS: flatten or cut adds on a weekly close under invalidation $43,963. TIME EXIT: if neither target nor stop by ~13 weeks, reassess — reduce if structure weakens.
When to add: Add on the first weekly close back above the 20W EMA after the touch, not while still slicing lower through it.
Risk / targets: Hard invalidation / exit: weekly close below $43,963 (-5.4% from entry). First take-profit / reduce zone: $51,102 (+10.0% from entry, ~1.9R). Horizon ~13 weeks unless stopped/target hit sooner.
Size: Size: starter 25–40% of intended BTC sleeve add; leave room to add once. Prefer spot/IBIT. Options/leverage only if portfolio regime already allows heavier risk/calls.
Action: HISTORICAL PLAN (not a live order): on 2021-05-16 the play was buy near $46,456, invalidation $43,963, target/exit $51,102. Outcome: LOSS.
If it fails: At the time, a weekly close under $43,963 meant exit/no add.
BTC is -1.3% from the 20-week EMA after a recent EMA-zone touch; weekly trend filter is on.
Evidence
Close $46,456 vs 20W EMA $47,082
26-week return 191.2%
20W EMA above 40W SMA
Extra notes
If already exposed: constructive add/hold zone while closes defend the 20W EMA.
Fresh long: stage, do not max-buy; prefer confirmation above this week's high or a green weekly close.
Avoid leverage if weekly close loses the 20W EMA and MACD histogram deteriorates.
Invalidation: Weekly close below 20W EMA / prior swing low zone ($43,963)
Trade plan used: Buy the breakout above flat resistance: staged long BTC/IBIT.
What trade: Buy the breakout above flat resistance: staged long BTC/IBIT.
When to put it on: Enter on a weekly close above triangle resistance/target zone ($66,225), with expanding volume preferred. Treat 2021-04-11 as the alert date; do not front-run a failed poke.
Entry instructions: ENTRY: buy near $60,205 on/after 2021-04-11 using a weekly close confirmation for the pattern. Do not market-chase far above entry without a plan; if price is already >3–4% through entry, wait for a hold/retest.
Exit instructions: EXIT WIN: scale out into $66,225 (first tranche at target; trail remainder above rising 20W EMA if trend continues). EXIT LOSS: flatten or cut adds on a weekly close under invalidation $1. TIME EXIT: if neither target nor stop by ~13 weeks, reassess — reduce if structure weakens.
When to add: Add on a retest of the breakout line that holds on a weekly close.
Risk / targets: Hard invalidation / exit: weekly close below $1 (-100.0% from entry). First take-profit / reduce zone: $66,225 (+10.0% from entry, ~0.1R). Horizon ~13 weeks unless stopped/target hit sooner.
Size: Size: starter 25–40% of intended BTC sleeve add; leave room to add once. Prefer spot/IBIT. Options/leverage only if portfolio regime already allows heavier risk/calls.
Action: HISTORICAL PLAN (not a live order): on 2021-04-11 the play was buy near $60,205, invalidation $1, target/exit $66,225. Outcome: LOSS.
If it fails: At the time, a weekly close under $1 meant exit/no add.
Flat resistance near $60,308 with 4 touches and rising-lows slope about 111.3% over the 20-week window.
Evidence
Resistance $60,308
Touches 4
High-band width 6.1%
Breakout near/no
Extra notes
Best trigger is weekly close above resistance with expanding volume.
If near resistance, wait for close/hold rather than front-running a failed breakout.
Retest of broken resistance is preferred add zone after breakout.
Invalidation: Weekly close below rising-lows trend / 20W EMA, or failed breakout back under $60,308.
Outcome reason: time stop @ horizon (close vs entry)
Trade plan used: Buy the cup-and-handle pivot breakout: smaller staged long until confirmed.
What trade: Buy the cup-and-handle pivot breakout: smaller staged long until confirmed.
When to put it on: Enter on a weekly close above the pivot ($63,294). If only the handle is forming around 2021-02-21, wait for the breakout close rather than guessing the bottom of the handle.
Entry instructions: ENTRY: buy near $57,540 on/after 2021-02-21 using a weekly close confirmation for the pattern. Do not market-chase far above entry without a plan; if price is already >3–4% through entry, wait for a hold/retest.
Exit instructions: EXIT WIN: scale out into $63,294 (first tranche at target; trail remainder above rising 20W EMA if trend continues). EXIT LOSS: flatten or cut adds on a weekly close under invalidation $17,620. TIME EXIT: if neither target nor stop by ~13 weeks, reassess — reduce if structure weakens.
When to add: Add only after the breakout holds for a full weekly close and the handle low stays intact.
Risk / targets: Hard invalidation / exit: weekly close below $17,620 (-69.4% from entry). First take-profit / reduce zone: $63,294 (+10.0% from entry, ~0.1R). Horizon ~13 weeks unless stopped/target hit sooner.
Size: Size: starter 25–40% of intended BTC sleeve add; leave room to add once. Prefer spot/IBIT. Options/leverage only if portfolio regime already allows heavier risk/calls.
Action: HISTORICAL PLAN (not a live order): on 2021-02-21 the play was buy near $57,540, invalidation $17,620, target/exit $63,294. Outcome: WIN.
If it fails: At the time, a weekly close under $17,620 meant exit/no add.
Potential rounded base: cup depth 64.4%, recovery to 72.2% from left rim, handle depth 11.2%; pivot near $19,846.
Evidence
Left rim $11,528
Cup low $4,107
Right rim $19,846
Pivot $19,846
Breakout yes
Extra notes
Treat as lower-confidence algorithmic pattern until visually confirmed on TradingView weekly candles.
Trigger is weekly close above pivot; handle should stay orderly and above 20W EMA.
Size smaller than EMA/MACD signals unless breakout volume confirms.
Invalidation: Handle low violation ($17,620) or weekly close back below pivot after breakout.
Trade plan used: Buy the pullback in an uptrend: staged long BTC/IBIT into the 20-week EMA zone.
What trade: Buy the pullback in an uptrend: staged long BTC/IBIT into the 20-week EMA zone.
When to put it on: When weekly price tags/holds the 20W EMA around the 2020-11-01 signal and the broader uptrend filter is still on (price and 20W EMA above the slower weekly average).
Entry instructions: ENTRY: buy near $13,737 on/after 2020-11-01 using a weekly close confirmation for the pattern. Do not market-chase far above entry without a plan; if price is already >3–4% through entry, wait for a hold/retest.
Exit instructions: EXIT WIN: scale out into $15,111 (first tranche at target; trail remainder above rising 20W EMA if trend continues). EXIT LOSS: flatten or cut adds on a weekly close under invalidation $10,978. TIME EXIT: if neither target nor stop by ~13 weeks, reassess — reduce if structure weakens.
When to add: Add on the first weekly close back above the 20W EMA after the touch, not while still slicing lower through it.
Risk / targets: Hard invalidation / exit: weekly close below $10,978 (-20.1% from entry). First take-profit / reduce zone: $15,111 (+10.0% from entry, ~0.5R). Horizon ~13 weeks unless stopped/target hit sooner.
Size: Size: starter 25–40% of intended BTC sleeve add; leave room to add once. Prefer spot/IBIT. Options/leverage only if portfolio regime already allows heavier risk/calls.
Action: HISTORICAL PLAN (not a live order): on 2020-11-01 the play was buy near $13,737, invalidation $10,978, target/exit $15,111. Outcome: WIN.
If it fails: At the time, a weekly close under $10,978 meant exit/no add.
BTC is 25.1% from the 20-week EMA after a recent EMA-zone touch; weekly trend filter is on.
Evidence
Close $13,737 vs 20W EMA $10,978
26-week return 54.4%
20W EMA above 40W SMA
Extra notes
If already exposed: constructive add/hold zone while closes defend the 20W EMA.
Fresh long: stage, do not max-buy; prefer confirmation above this week's high or a green weekly close.
Avoid leverage if weekly close loses the 20W EMA and MACD histogram deteriorates.
Invalidation: Weekly close below 20W EMA / prior swing low zone ($9,916)
Trade plan used: Buy the breakout above flat resistance: staged long BTC/IBIT.
What trade: Buy the breakout above flat resistance: staged long BTC/IBIT.
When to put it on: Enter on a weekly close above triangle resistance/target zone ($14,334), with expanding volume preferred. Treat 2020-10-25 as the alert date; do not front-run a failed poke.
Entry instructions: ENTRY: buy near $13,031 on/after 2020-10-25 using a weekly close confirmation for the pattern. Do not market-chase far above entry without a plan; if price is already >3–4% through entry, wait for a hold/retest.
Exit instructions: EXIT WIN: scale out into $14,334 (first tranche at target; trail remainder above rising 20W EMA if trend continues). EXIT LOSS: flatten or cut adds on a weekly close under invalidation $11,989. TIME EXIT: if neither target nor stop by ~13 weeks, reassess — reduce if structure weakens.
When to add: Add on a retest of the breakout line that holds on a weekly close.
Risk / targets: Hard invalidation / exit: weekly close below $11,989 (-8.0% from entry). First take-profit / reduce zone: $14,334 (+10.0% from entry, ~1.2R). Horizon ~13 weeks unless stopped/target hit sooner.
Size: Size: starter 25–40% of intended BTC sleeve add; leave room to add once. Prefer spot/IBIT. Options/leverage only if portfolio regime already allows heavier risk/calls.
Action: HISTORICAL PLAN (not a live order): on 2020-10-25 the play was buy near $13,031, invalidation $11,989, target/exit $14,334. Outcome: WIN.
If it fails: At the time, a weekly close under $11,989 meant exit/no add.
Flat resistance near $12,080 with 7 touches and rising-lows slope about 21.3% over the 20-week window.
Evidence
Resistance $12,080
Touches 7
High-band width 4.8%
Breakout yes
Extra notes
Best trigger is weekly close above resistance with expanding volume.
If near resistance, wait for close/hold rather than front-running a failed breakout.
Retest of broken resistance is preferred add zone after breakout.
Invalidation: Weekly close below rising-lows trend / 20W EMA, or failed breakout back under $12,080.
Trade plan used: Buy a small staged long in BTC or IBIT (spot first; no leverage unless portfolio regime is already risk-on).
What trade: Buy a small staged long in BTC or IBIT (spot first; no leverage unless portfolio regime is already risk-on).
When to put it on: On/after the weekly close that printed the MACD bullish cross (2020-10-18). Best if price is reclaiming or holding above the 20-week EMA; if still below a falling 20W EMA, wait for a weekly close back above it before sizing up.
Entry instructions: ENTRY: buy near $11,483 on/after 2020-10-18 using a weekly close confirmation for the pattern. Do not market-chase far above entry without a plan; if price is already >3–4% through entry, wait for a hold/retest.
Exit instructions: EXIT WIN: scale out into $12,632 (first tranche at target; trail remainder above rising 20W EMA if trend continues). EXIT LOSS: flatten or cut adds on a weekly close under invalidation $10,565. TIME EXIT: if neither target nor stop by ~13 weeks, reassess — reduce if structure weakens.
When to add: Add only on a green weekly close that keeps MACD above signal, or on a shallow retest that holds the 20W EMA.
Risk / targets: Hard invalidation / exit: weekly close below $10,565 (-8.0% from entry). First take-profit / reduce zone: $12,632 (+10.0% from entry, ~1.3R). Horizon ~13 weeks unless stopped/target hit sooner.
Size: Size: starter 25–40% of intended BTC sleeve add; leave room to add once. Prefer spot/IBIT. Options/leverage only if portfolio regime already allows heavier risk/calls.
Action: HISTORICAL PLAN (not a live order): on 2020-10-18 the play was buy near $11,483, invalidation $10,565, target/exit $12,632. Outcome: WIN.
If it fails: At the time, a weekly close under $10,565 meant exit/no add.
Weekly MACD line is 653 vs signal 651; histogram 2.
Evidence
MACD 653
Signal 651
Histogram 2
Prior histogram -11
Extra notes
Bullish momentum inflection; best when price is above/rising 20W EMA.
Use as confirmation for staged spot/IBIT exposure rather than a standalone all-in trigger.
If cross occurs below a falling 20W EMA, downgrade to watchlist-only.
Invalidation: MACD line rolls back below signal on weekly close or histogram flips materially negative.
Trade plan used: Buy the pullback in an uptrend: staged long BTC/IBIT into the 20-week EMA zone.
What trade: Buy the pullback in an uptrend: staged long BTC/IBIT into the 20-week EMA zone.
When to put it on: When weekly price tags/holds the 20W EMA around the 2020-09-06 signal and the broader uptrend filter is still on (price and 20W EMA above the slower weekly average).
Entry instructions: ENTRY: buy near $10,280 on/after 2020-09-06 using a weekly close confirmation for the pattern. Do not market-chase far above entry without a plan; if price is already >3–4% through entry, wait for a hold/retest.
Exit instructions: EXIT WIN: scale out into $11,308 (first tranche at target; trail remainder above rising 20W EMA if trend continues). EXIT LOSS: flatten or cut adds on a weekly close under invalidation $9,991. TIME EXIT: if neither target nor stop by ~13 weeks, reassess — reduce if structure weakens.
When to add: Add on the first weekly close back above the 20W EMA after the touch, not while still slicing lower through it.
Risk / targets: Hard invalidation / exit: weekly close below $9,991 (-2.8% from entry). First take-profit / reduce zone: $11,308 (+10.0% from entry, ~3.6R). Horizon ~13 weeks unless stopped/target hit sooner.
Size: Size: starter 25–40% of intended BTC sleeve add; leave room to add once. Prefer spot/IBIT. Options/leverage only if portfolio regime already allows heavier risk/calls.
Action: HISTORICAL PLAN (not a live order): on 2020-09-06 the play was buy near $10,280, invalidation $9,991, target/exit $11,308. Outcome: LOSS.
If it fails: At the time, a weekly close under $9,991 meant exit/no add.
BTC is 2.9% from the 20-week EMA after a recent EMA-zone touch; weekly trend filter is on.
Evidence
Close $10,280 vs 20W EMA $9,991
26-week return 26.8%
20W EMA above 40W SMA
Extra notes
If already exposed: constructive add/hold zone while closes defend the 20W EMA.
Fresh long: stage, do not max-buy; prefer confirmation above this week's high or a green weekly close.
Avoid leverage if weekly close loses the 20W EMA and MACD histogram deteriorates.
Invalidation: Weekly close below 20W EMA / prior swing low zone ($9,089)
Trade plan used: Buy strength on the flag breakout: staged long BTC/IBIT.
What trade: Buy strength on the flag breakout: staged long BTC/IBIT.
When to put it on: Prefer entry on a weekly close through flag resistance near $10,200, not mid-flag. The 2020-07-26 signal marks the setup window.
Entry instructions: ENTRY: buy near $9,905 on/after 2020-07-26 using a weekly close confirmation for the pattern. Do not market-chase far above entry without a plan; if price is already >3–4% through entry, wait for a hold/retest.
Exit instructions: EXIT WIN: scale out into $10,200 (first tranche at target; trail remainder above rising 20W EMA if trend continues). EXIT LOSS: flatten or cut adds on a weekly close under invalidation $8,976. TIME EXIT: if neither target nor stop by ~13 weeks, reassess — reduce if structure weakens.
When to add: Add on a successful retest of broken flag resistance that holds as support.
Risk / targets: Hard invalidation / exit: weekly close below $8,976 (-9.4% from entry). First take-profit / reduce zone: $10,200 (+3.0% from entry, ~0.3R). Horizon ~13 weeks unless stopped/target hit sooner.
Size: Size: starter 25–40% of intended BTC sleeve add; leave room to add once. Prefer spot/IBIT. Options/leverage only if portfolio regime already allows heavier risk/calls.
Action: HISTORICAL PLAN (not a live order): on 2020-07-26 the play was buy near $9,905, invalidation $8,976, target/exit $10,200. Outcome: WIN.
If it fails: At the time, a weekly close under $8,976 meant exit/no add.
Prior 8-week thrust max 65.9% followed by 8-week consolidation range 13.6%; breakout filter not met.
Evidence
8W base high $10,200
8W base low $8,976
Base drift 1.5%
Volume cool-down yes
Extra notes
A weekly close through flag resistance supports adding strength.
If still inside flag, wait for breakout; avoid buying middle of range unless this overlaps 20W EMA support.
Target is measured-move/ATH zone, but trail risk below flag low.
Invalidation: Weekly close below flag low/support ($8,976)
Trade plan used: Buy the breakout above flat resistance: staged long BTC/IBIT.
What trade: Buy the breakout above flat resistance: staged long BTC/IBIT.
When to put it on: Enter on a weekly close above triangle resistance/target zone ($10,896), with expanding volume preferred. Treat 2020-07-26 as the alert date; do not front-run a failed poke.
Entry instructions: ENTRY: buy near $9,905 on/after 2020-07-26 using a weekly close confirmation for the pattern. Do not market-chase far above entry without a plan; if price is already >3–4% through entry, wait for a hold/retest.
Exit instructions: EXIT WIN: scale out into $10,896 (first tranche at target; trail remainder above rising 20W EMA if trend continues). EXIT LOSS: flatten or cut adds on a weekly close under invalidation $1. TIME EXIT: if neither target nor stop by ~13 weeks, reassess — reduce if structure weakens.
When to add: Add on a retest of the breakout line that holds on a weekly close.
Risk / targets: Hard invalidation / exit: weekly close below $1 (-100.0% from entry). First take-profit / reduce zone: $10,896 (+10.0% from entry, ~0.1R). Horizon ~13 weeks unless stopped/target hit sooner.
Size: Size: starter 25–40% of intended BTC sleeve add; leave room to add once. Prefer spot/IBIT. Options/leverage only if portfolio regime already allows heavier risk/calls.
Action: HISTORICAL PLAN (not a live order): on 2020-07-26 the play was buy near $9,905, invalidation $1, target/exit $10,896. Outcome: WIN.
If it fails: At the time, a weekly close under $1 meant exit/no add.
Flat resistance near $9,947 with 7 touches and rising-lows slope about 60.5% over the 20-week window.
Evidence
Resistance $9,947
Touches 7
High-band width 3.0%
Breakout near/no
Extra notes
Best trigger is weekly close above resistance with expanding volume.
If near resistance, wait for close/hold rather than front-running a failed breakout.
Retest of broken resistance is preferred add zone after breakout.
Invalidation: Weekly close below rising-lows trend / 20W EMA, or failed breakout back under $9,947.
Trade plan used: Buy the pullback in an uptrend: staged long BTC/IBIT into the 20-week EMA zone.
What trade: Buy the pullback in an uptrend: staged long BTC/IBIT into the 20-week EMA zone.
When to put it on: When weekly price tags/holds the 20W EMA around the 2020-06-07 signal and the broader uptrend filter is still on (price and 20W EMA above the slower weekly average).
Entry instructions: ENTRY: buy near $9,759 on/after 2020-06-07 using a weekly close confirmation for the pattern. Do not market-chase far above entry without a plan; if price is already >3–4% through entry, wait for a hold/retest.
Exit instructions: EXIT WIN: scale out into $10,735 (first tranche at target; trail remainder above rising 20W EMA if trend continues). EXIT LOSS: flatten or cut adds on a weekly close under invalidation $8,404. TIME EXIT: if neither target nor stop by ~13 weeks, reassess — reduce if structure weakens.
When to add: Add on the first weekly close back above the 20W EMA after the touch, not while still slicing lower through it.
Risk / targets: Hard invalidation / exit: weekly close below $8,404 (-13.9% from entry). First take-profit / reduce zone: $10,735 (+10.0% from entry, ~0.7R). Horizon ~13 weeks unless stopped/target hit sooner.
Size: Size: starter 25–40% of intended BTC sleeve add; leave room to add once. Prefer spot/IBIT. Options/leverage only if portfolio regime already allows heavier risk/calls.
Action: HISTORICAL PLAN (not a live order): on 2020-06-07 the play was buy near $9,759, invalidation $8,404, target/exit $10,735. Outcome: WIN.
If it fails: At the time, a weekly close under $8,404 meant exit/no add.
BTC is 16.1% from the 20-week EMA after a recent EMA-zone touch; weekly trend filter is on.
Evidence
Close $9,759 vs 20W EMA $8,404
26-week return 29.0%
20W EMA above 40W SMA
Extra notes
If already exposed: constructive add/hold zone while closes defend the 20W EMA.
Fresh long: stage, do not max-buy; prefer confirmation above this week's high or a green weekly close.
Avoid leverage if weekly close loses the 20W EMA and MACD histogram deteriorates.
Invalidation: Weekly close below 20W EMA / prior swing low zone ($6,556)
Trade plan used: Buy a small staged long in BTC or IBIT (spot first; no leverage unless portfolio regime is already risk-on).
What trade: Buy a small staged long in BTC or IBIT (spot first; no leverage unless portfolio regime is already risk-on).
When to put it on: On/after the weekly close that printed the MACD bullish cross (2020-05-03). Best if price is reclaiming or holding above the 20-week EMA; if still below a falling 20W EMA, wait for a weekly close back above it before sizing up.
Entry instructions: ENTRY: buy near $8,897 on/after 2020-05-03 using a weekly close confirmation for the pattern. Do not market-chase far above entry without a plan; if price is already >3–4% through entry, wait for a hold/retest.
Exit instructions: EXIT WIN: scale out into $9,787 (first tranche at target; trail remainder above rising 20W EMA if trend continues). EXIT LOSS: flatten or cut adds on a weekly close under invalidation $8,186. TIME EXIT: if neither target nor stop by ~13 weeks, reassess — reduce if structure weakens.
When to add: Add only on a green weekly close that keeps MACD above signal, or on a shallow retest that holds the 20W EMA.
Risk / targets: Hard invalidation / exit: weekly close below $8,186 (-8.0% from entry). First take-profit / reduce zone: $9,787 (+10.0% from entry, ~1.3R). Horizon ~13 weeks unless stopped/target hit sooner.
Size: Size: starter 25–40% of intended BTC sleeve add; leave room to add once. Prefer spot/IBIT. Options/leverage only if portfolio regime already allows heavier risk/calls.
Action: HISTORICAL PLAN (not a live order): on 2020-05-03 the play was buy near $8,897, invalidation $8,186, target/exit $9,787. Outcome: WIN.
If it fails: At the time, a weekly close under $8,186 meant exit/no add.
Weekly MACD line is -257 vs signal -300; histogram 43.
Evidence
MACD -257
Signal -300
Histogram 43
Prior histogram -95
Extra notes
Bullish momentum inflection; best when price is above/rising 20W EMA.
Use as confirmation for staged spot/IBIT exposure rather than a standalone all-in trigger.
If cross occurs below a falling 20W EMA, downgrade to watchlist-only.
Invalidation: MACD line rolls back below signal on weekly close or histogram flips materially negative.
Trade plan used: Buy a small staged long in BTC or IBIT (spot first; no leverage unless portfolio regime is already risk-on).
What trade: Buy a small staged long in BTC or IBIT (spot first; no leverage unless portfolio regime is already risk-on).
When to put it on: On/after the weekly close that printed the MACD bullish cross (2020-02-02). Best if price is reclaiming or holding above the 20-week EMA; if still below a falling 20W EMA, wait for a weekly close back above it before sizing up.
Entry instructions: ENTRY: buy near $9,344 on/after 2020-02-02 using a weekly close confirmation for the pattern. Do not market-chase far above entry without a plan; if price is already >3–4% through entry, wait for a hold/retest.
Exit instructions: EXIT WIN: scale out into $10,279 (first tranche at target; trail remainder above rising 20W EMA if trend continues). EXIT LOSS: flatten or cut adds on a weekly close under invalidation $8,597. TIME EXIT: if neither target nor stop by ~13 weeks, reassess — reduce if structure weakens.
When to add: Add only on a green weekly close that keeps MACD above signal, or on a shallow retest that holds the 20W EMA.
Risk / targets: Hard invalidation / exit: weekly close below $8,597 (-8.0% from entry). First take-profit / reduce zone: $10,279 (+10.0% from entry, ~1.3R). Horizon ~13 weeks unless stopped/target hit sooner.
Size: Size: starter 25–40% of intended BTC sleeve add; leave room to add once. Prefer spot/IBIT. Options/leverage only if portfolio regime already allows heavier risk/calls.
Action: HISTORICAL PLAN (not a live order): on 2020-02-02 the play was buy near $9,344, invalidation $8,597, target/exit $10,279. Outcome: WIN.
If it fails: At the time, a weekly close under $8,597 meant exit/no add.
Weekly MACD line is -27 vs signal -102; histogram 75.
Evidence
MACD -27
Signal -102
Histogram 75
Prior histogram -11
Extra notes
Bullish momentum inflection; best when price is above/rising 20W EMA.
Use as confirmation for staged spot/IBIT exposure rather than a standalone all-in trigger.
If cross occurs below a falling 20W EMA, downgrade to watchlist-only.
Invalidation: MACD line rolls back below signal on weekly close or histogram flips materially negative.
Trade plan used: Buy the pullback in an uptrend: staged long BTC/IBIT into the 20-week EMA zone.
What trade: Buy the pullback in an uptrend: staged long BTC/IBIT into the 20-week EMA zone.
When to put it on: When weekly price tags/holds the 20W EMA around the 2019-10-27 signal and the broader uptrend filter is still on (price and 20W EMA above the slower weekly average).
Entry instructions: ENTRY: buy near $9,552 on/after 2019-10-27 using a weekly close confirmation for the pattern. Do not market-chase far above entry without a plan; if price is already >3–4% through entry, wait for a hold/retest.
Exit instructions: EXIT WIN: scale out into $10,507 (first tranche at target; trail remainder above rising 20W EMA if trend continues). EXIT LOSS: flatten or cut adds on a weekly close under invalidation $9,051. TIME EXIT: if neither target nor stop by ~13 weeks, reassess — reduce if structure weakens.
When to add: Add on the first weekly close back above the 20W EMA after the touch, not while still slicing lower through it.
Risk / targets: Hard invalidation / exit: weekly close below $9,051 (-5.2% from entry). First take-profit / reduce zone: $10,507 (+10.0% from entry, ~1.9R). Horizon ~13 weeks unless stopped/target hit sooner.
Size: Size: starter 25–40% of intended BTC sleeve add; leave room to add once. Prefer spot/IBIT. Options/leverage only if portfolio regime already allows heavier risk/calls.
Action: HISTORICAL PLAN (not a live order): on 2019-10-27 the play was buy near $9,552, invalidation $9,051, target/exit $10,507. Outcome: LOSS.
If it fails: At the time, a weekly close under $9,051 meant exit/no add.
BTC is 5.5% from the 20-week EMA after a recent EMA-zone touch; weekly trend filter is on.
Evidence
Close $9,552 vs 20W EMA $9,051
26-week return 80.7%
20W EMA above 40W SMA
Extra notes
If already exposed: constructive add/hold zone while closes defend the 20W EMA.
Fresh long: stage, do not max-buy; prefer confirmation above this week's high or a green weekly close.
Avoid leverage if weekly close loses the 20W EMA and MACD histogram deteriorates.
Invalidation: Weekly close below 20W EMA / prior swing low zone ($7,447)
Trade plan used: Buy the pullback in an uptrend: staged long BTC/IBIT into the 20-week EMA zone.
What trade: Buy the pullback in an uptrend: staged long BTC/IBIT into the 20-week EMA zone.
When to put it on: When weekly price tags/holds the 20W EMA around the 2019-05-19 signal and the broader uptrend filter is still on (price and 20W EMA above the slower weekly average).
Entry instructions: ENTRY: buy near $8,198 on/after 2019-05-19 using a weekly close confirmation for the pattern. Do not market-chase far above entry without a plan; if price is already >3–4% through entry, wait for a hold/retest.
Exit instructions: EXIT WIN: scale out into $9,017 (first tranche at target; trail remainder above rising 20W EMA if trend continues). EXIT LOSS: flatten or cut adds on a weekly close under invalidation $5,235. TIME EXIT: if neither target nor stop by ~13 weeks, reassess — reduce if structure weakens.
When to add: Add on the first weekly close back above the 20W EMA after the touch, not while still slicing lower through it.
Risk / targets: Hard invalidation / exit: weekly close below $5,235 (-36.1% from entry). First take-profit / reduce zone: $9,017 (+10.0% from entry, ~0.3R). Horizon ~13 weeks unless stopped/target hit sooner.
Size: Size: starter 25–40% of intended BTC sleeve add; leave room to add once. Prefer spot/IBIT. Options/leverage only if portfolio regime already allows heavier risk/calls.
Action: HISTORICAL PLAN (not a live order): on 2019-05-19 the play was buy near $8,198, invalidation $5,235, target/exit $9,017. Outcome: WIN.
If it fails: At the time, a weekly close under $5,235 meant exit/no add.
BTC is 56.6% from the 20-week EMA after a recent EMA-zone touch; weekly trend filter is on.
Evidence
Close $8,198 vs 20W EMA $5,235
26-week return 45.8%
20W EMA above 40W SMA
Extra notes
If already exposed: constructive add/hold zone while closes defend the 20W EMA.
Fresh long: stage, do not max-buy; prefer confirmation above this week's high or a green weekly close.
Avoid leverage if weekly close loses the 20W EMA and MACD histogram deteriorates.
Invalidation: Weekly close below 20W EMA / prior swing low zone ($3,934)
Trade plan used: Buy a small staged long in BTC or IBIT (spot first; no leverage unless portfolio regime is already risk-on).
What trade: Buy a small staged long in BTC or IBIT (spot first; no leverage unless portfolio regime is already risk-on).
When to put it on: On/after the weekly close that printed the MACD bullish cross (2019-02-17). Best if price is reclaiming or holding above the 20-week EMA; if still below a falling 20W EMA, wait for a weekly close back above it before sizing up.
Entry instructions: ENTRY: buy near $3,674 on/after 2019-02-17 using a weekly close confirmation for the pattern. Do not market-chase far above entry without a plan; if price is already >3–4% through entry, wait for a hold/retest.
Exit instructions: EXIT WIN: scale out into $4,041 (first tranche at target; trail remainder above rising 20W EMA if trend continues). EXIT LOSS: flatten or cut adds on a weekly close under invalidation $3,380. TIME EXIT: if neither target nor stop by ~13 weeks, reassess — reduce if structure weakens.
When to add: Add only on a green weekly close that keeps MACD above signal, or on a shallow retest that holds the 20W EMA.
Risk / targets: Hard invalidation / exit: weekly close below $3,380 (-8.0% from entry). First take-profit / reduce zone: $4,041 (+10.0% from entry, ~1.2R). Horizon ~13 weeks unless stopped/target hit sooner.
Size: Size: starter 25–40% of intended BTC sleeve add; leave room to add once. Prefer spot/IBIT. Options/leverage only if portfolio regime already allows heavier risk/calls.
Action: HISTORICAL PLAN (not a live order): on 2019-02-17 the play was buy near $3,674, invalidation $3,380, target/exit $4,041. Outcome: WIN.
If it fails: At the time, a weekly close under $3,380 meant exit/no add.
Weekly MACD line is -877 vs signal -897; histogram 19.
Evidence
MACD -877
Signal -897
Histogram 19
Prior histogram -14
Extra notes
Bullish momentum inflection; best when price is above/rising 20W EMA.
Use as confirmation for staged spot/IBIT exposure rather than a standalone all-in trigger.
If cross occurs below a falling 20W EMA, downgrade to watchlist-only.
Invalidation: MACD line rolls back below signal on weekly close or histogram flips materially negative.
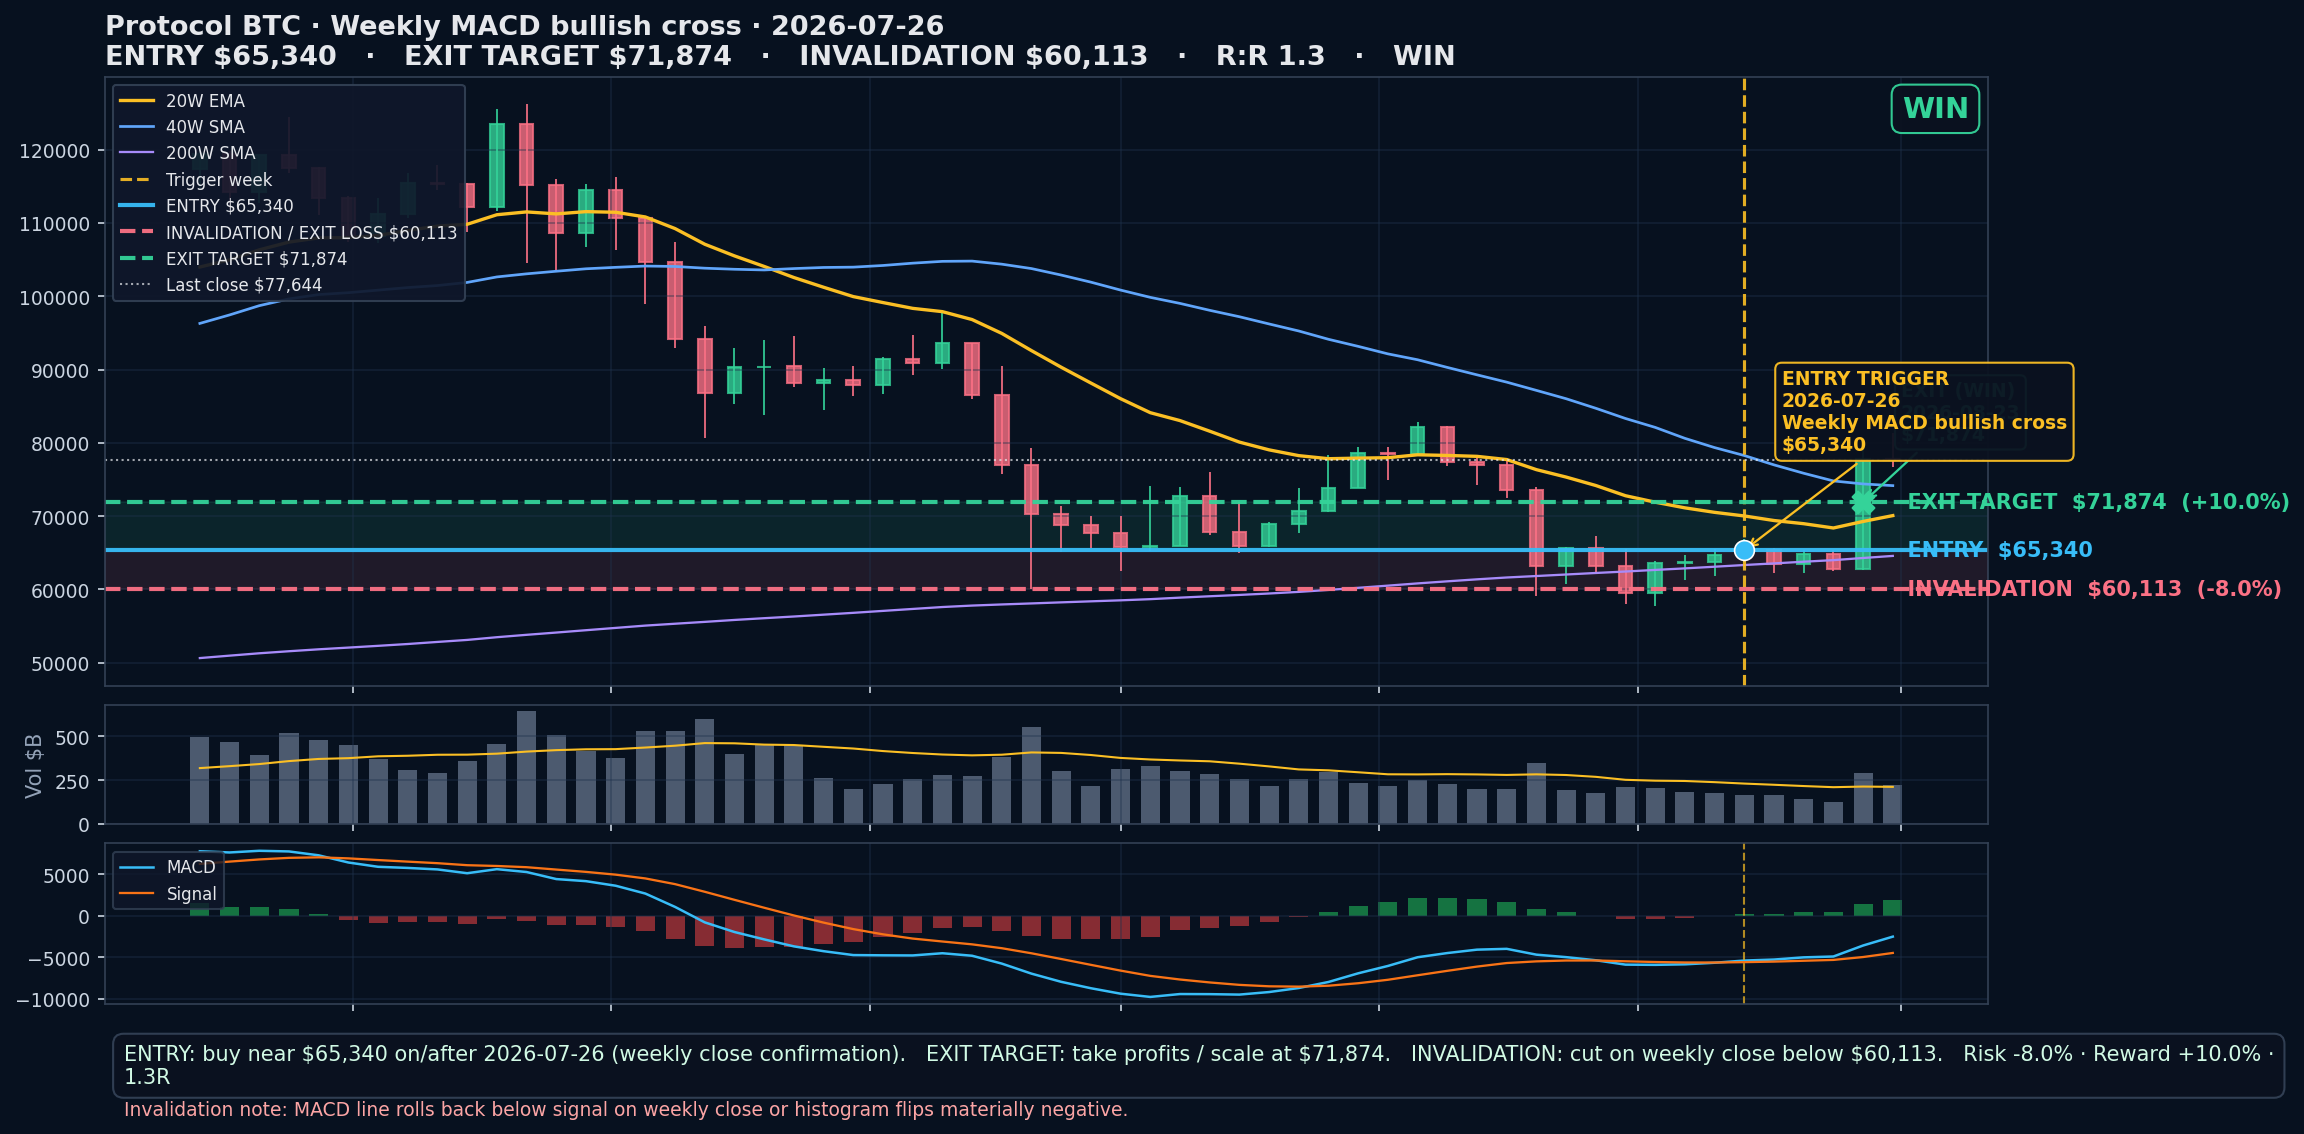
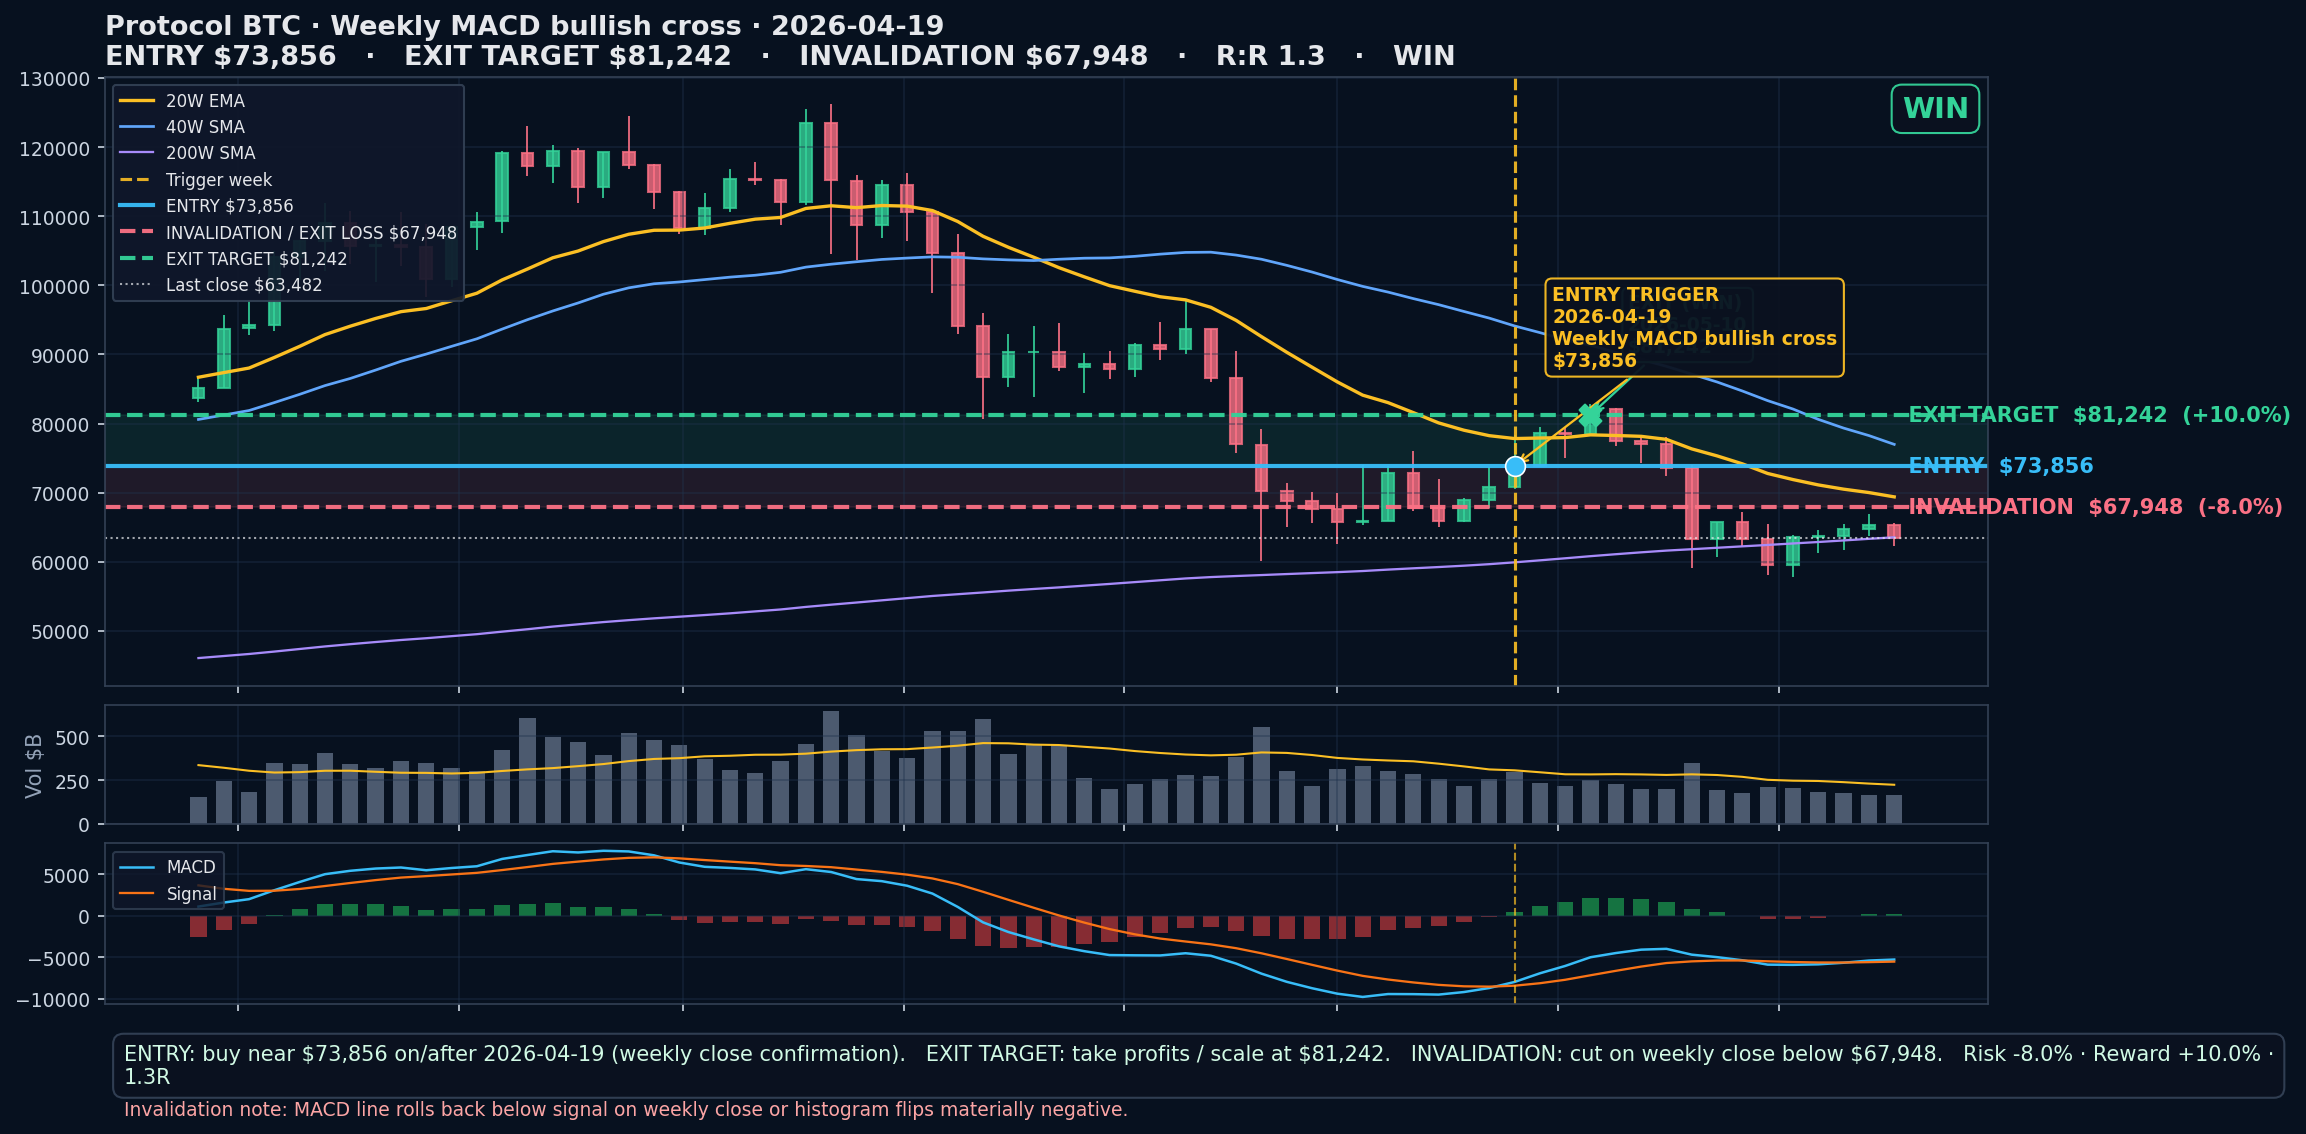
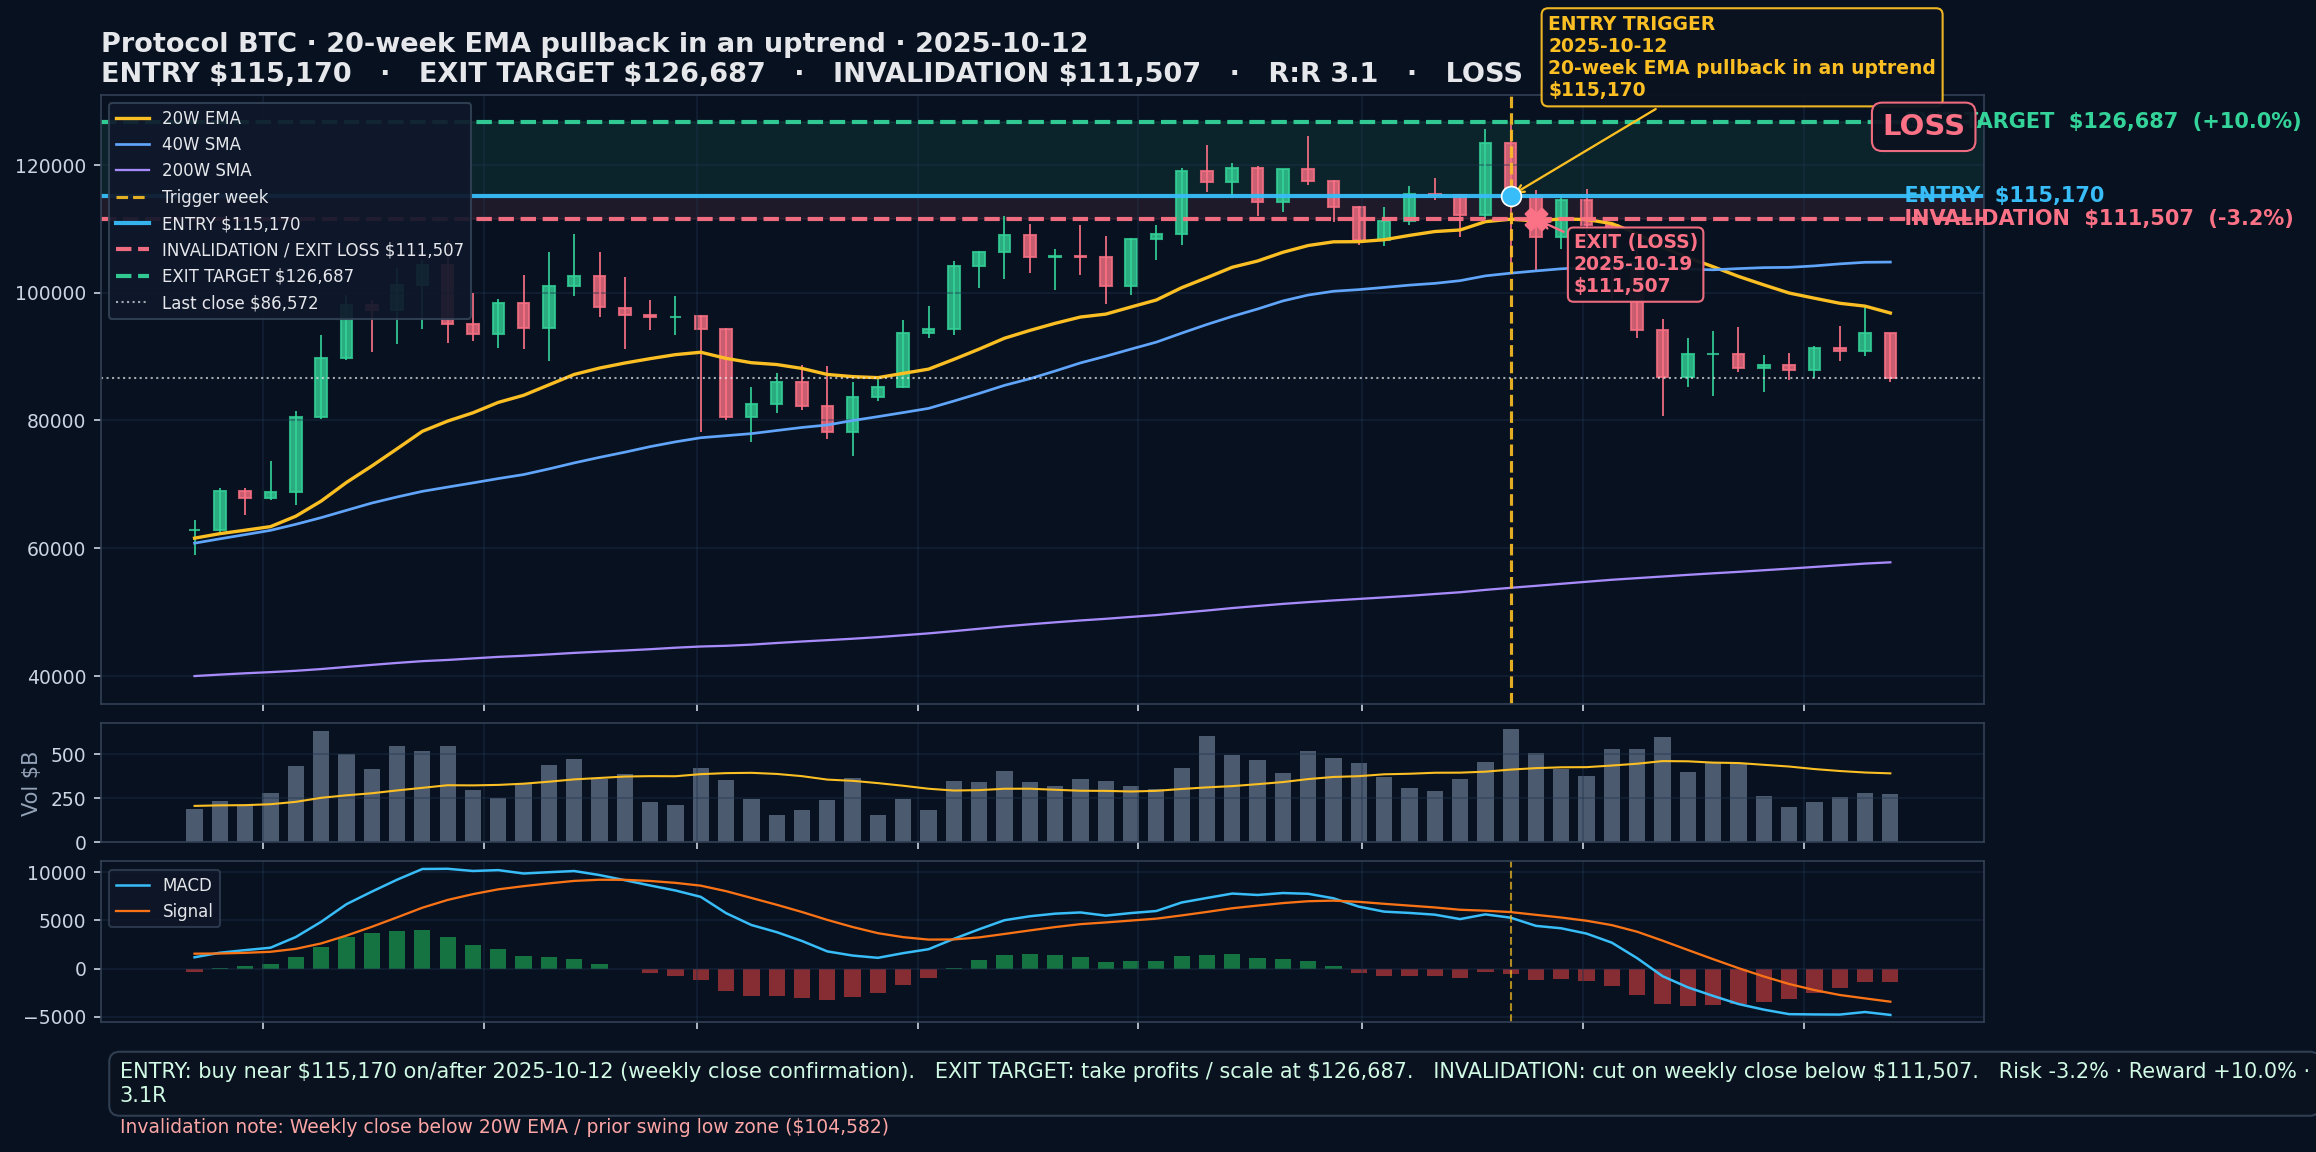
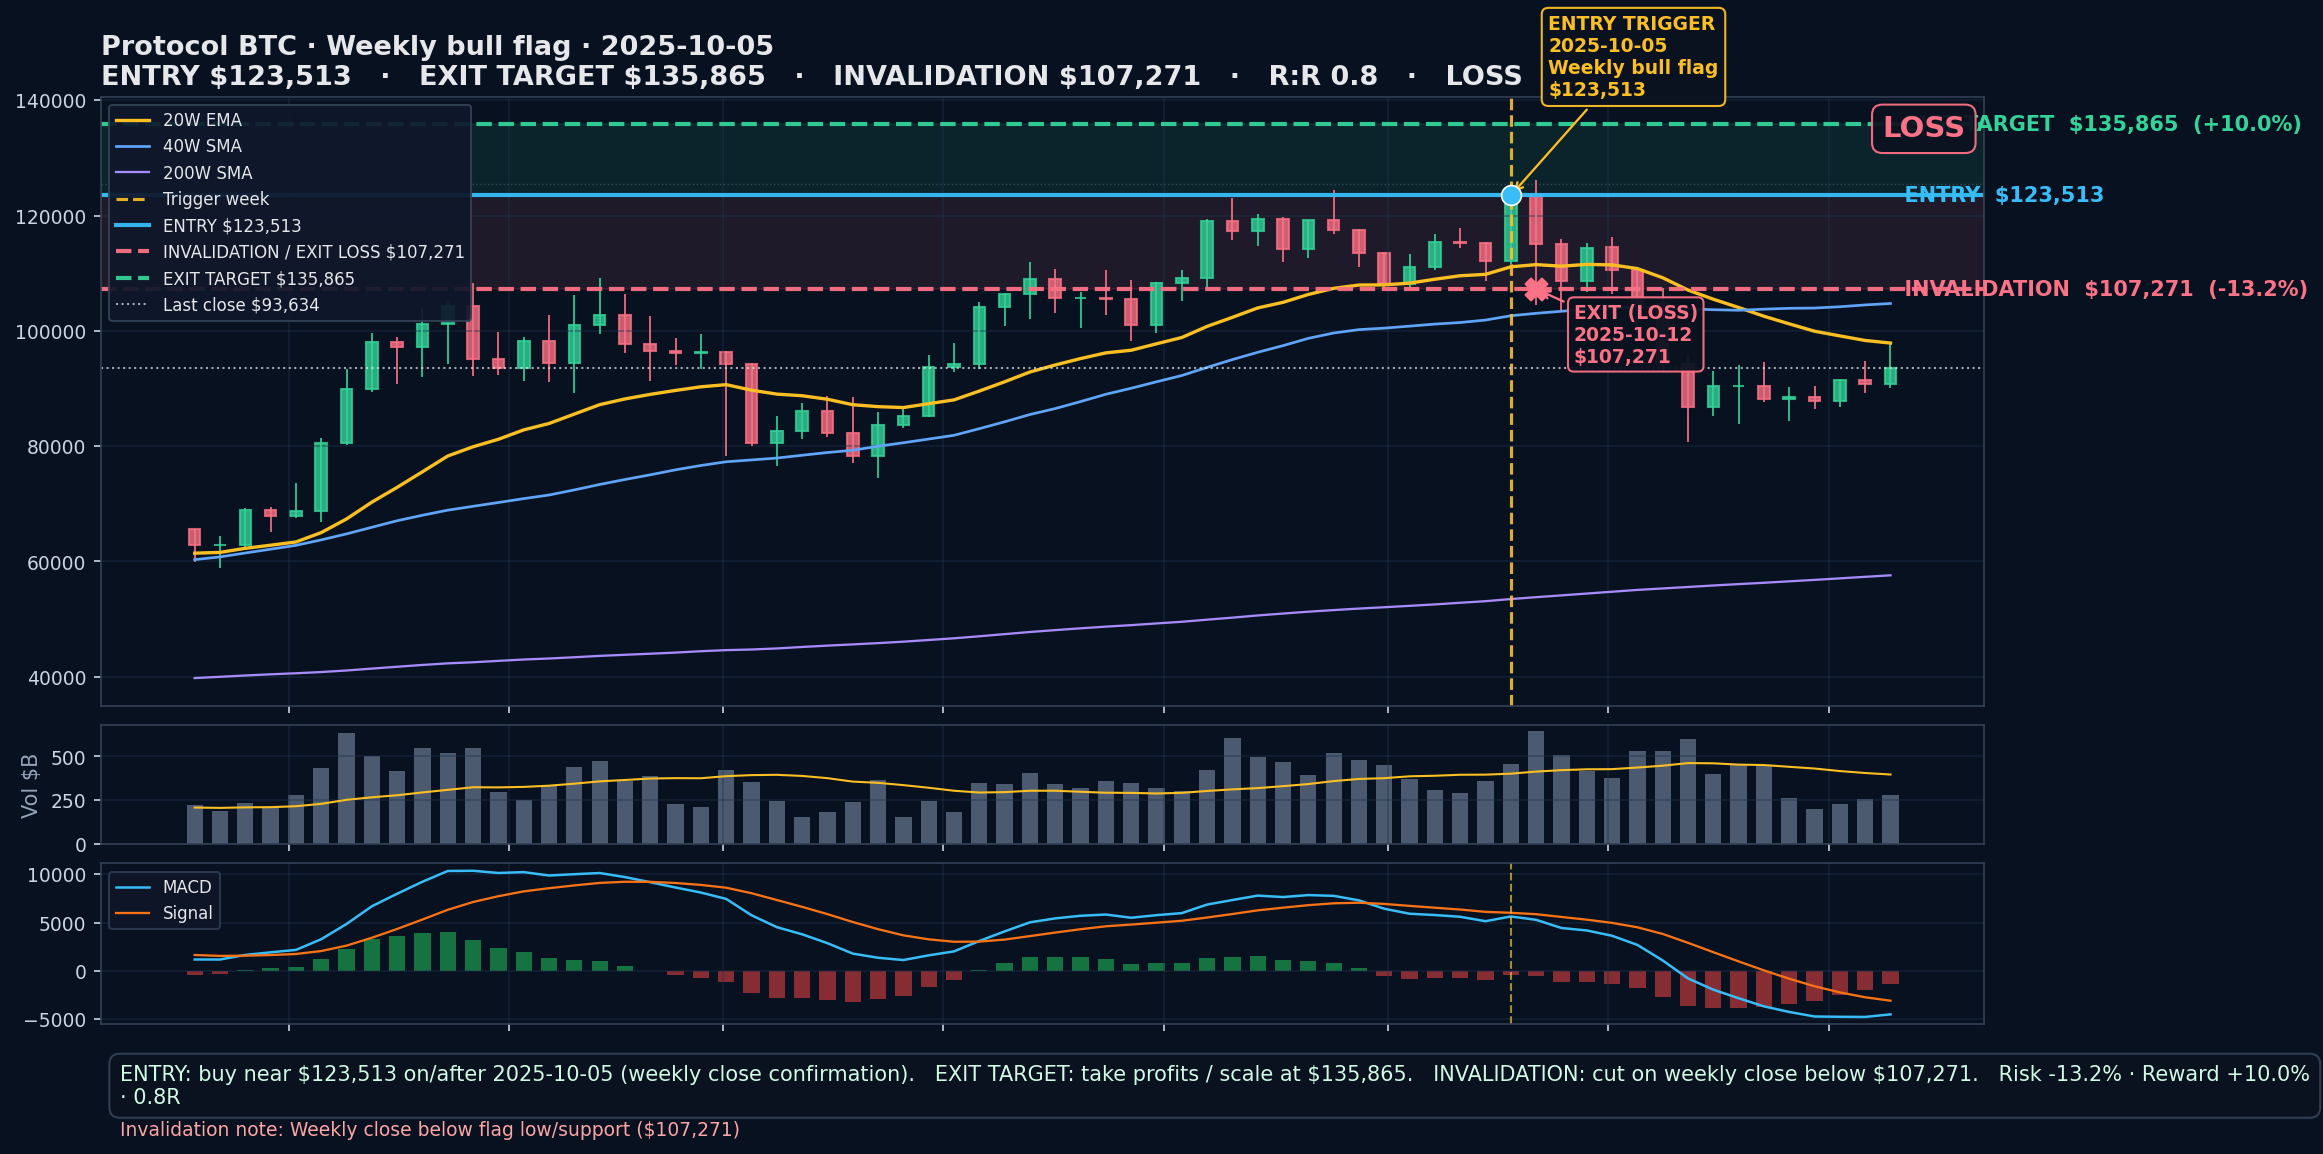
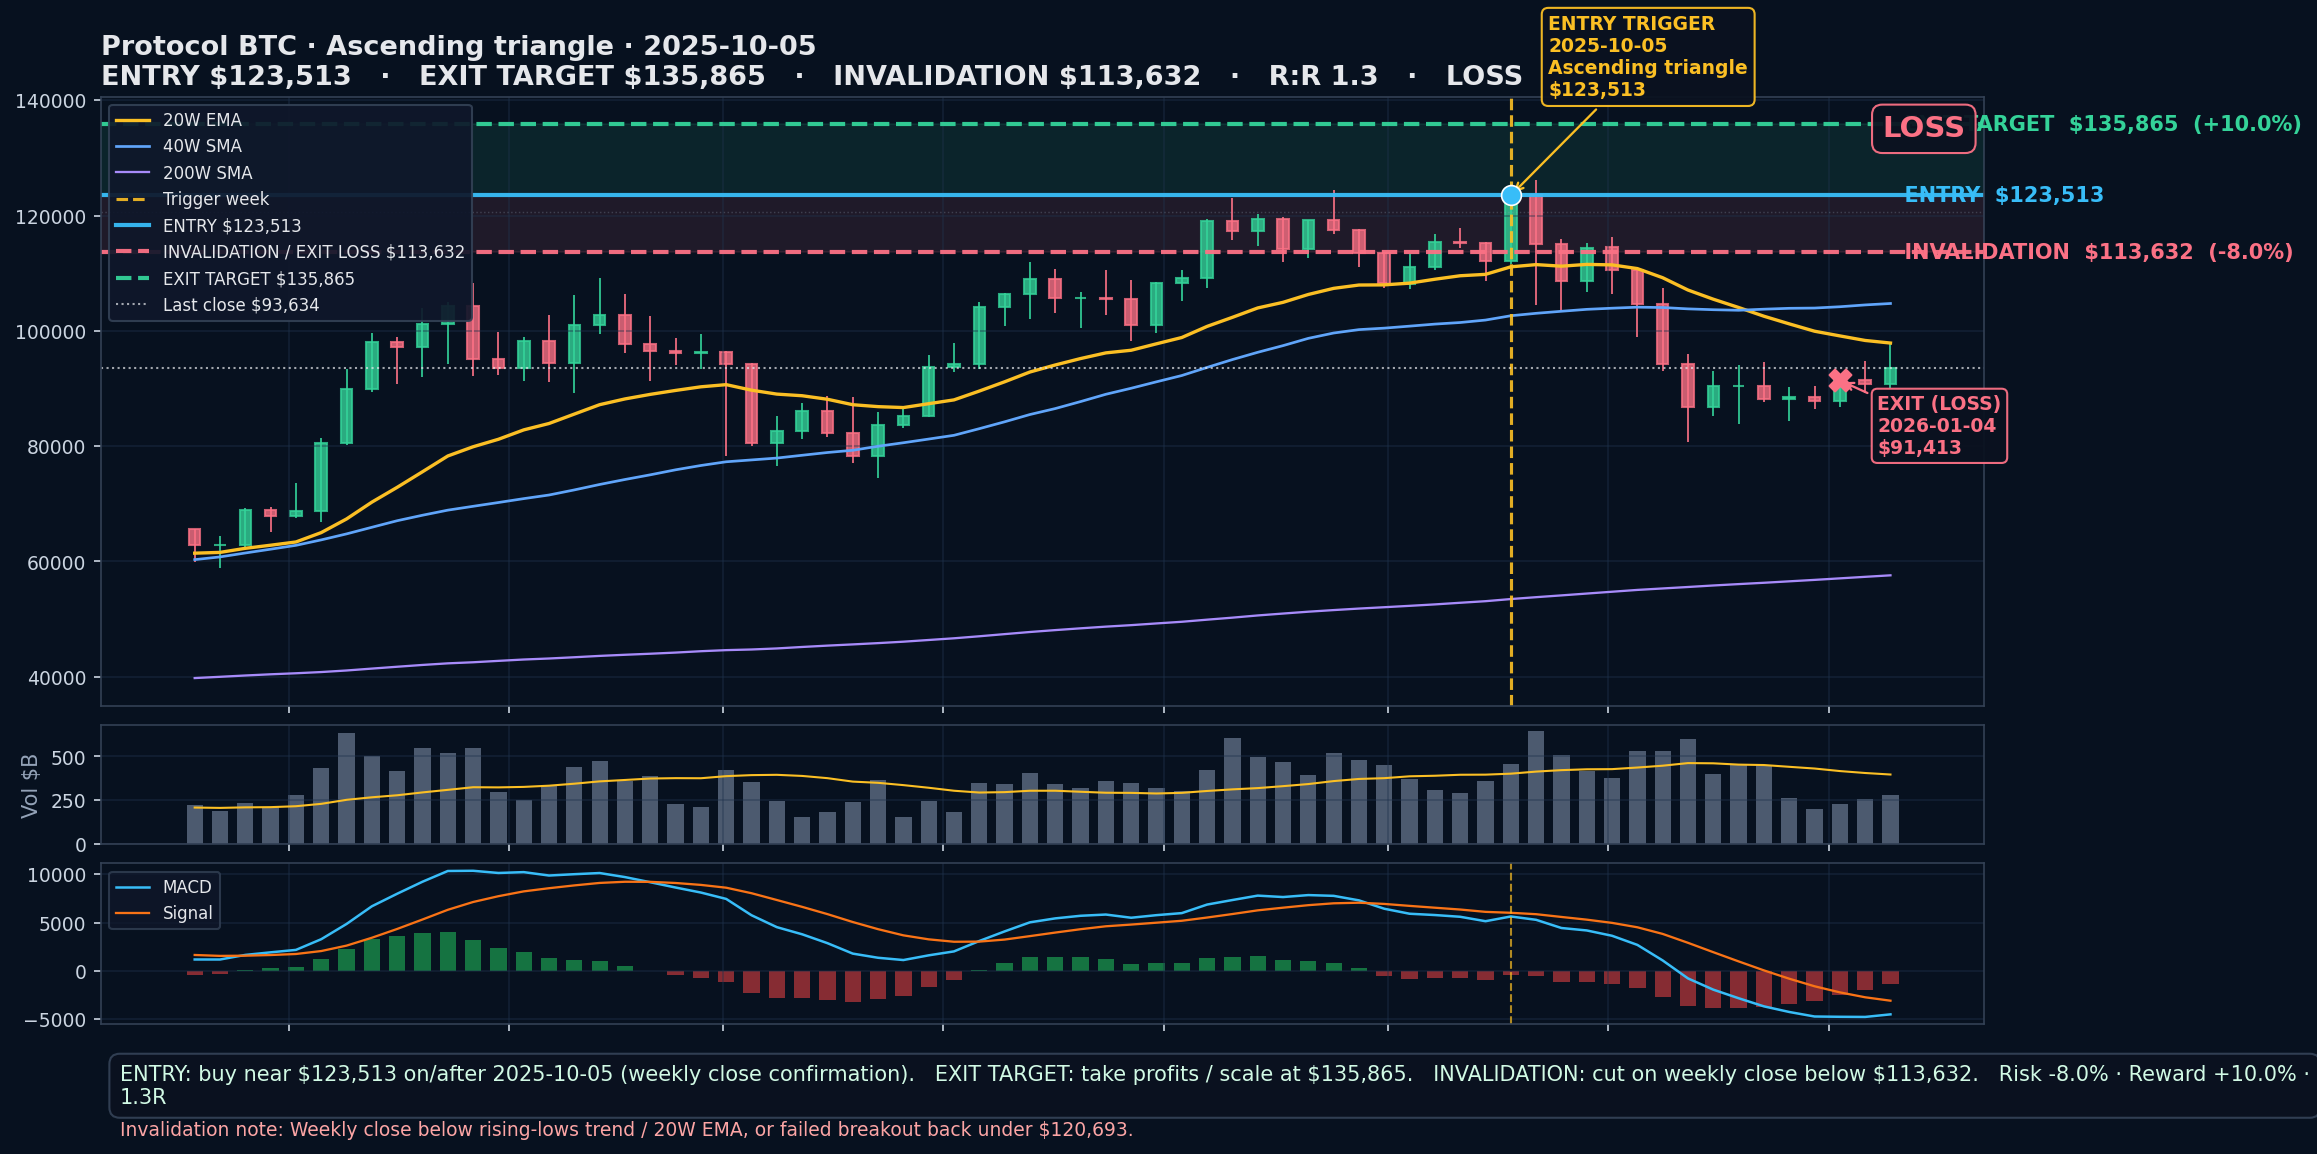
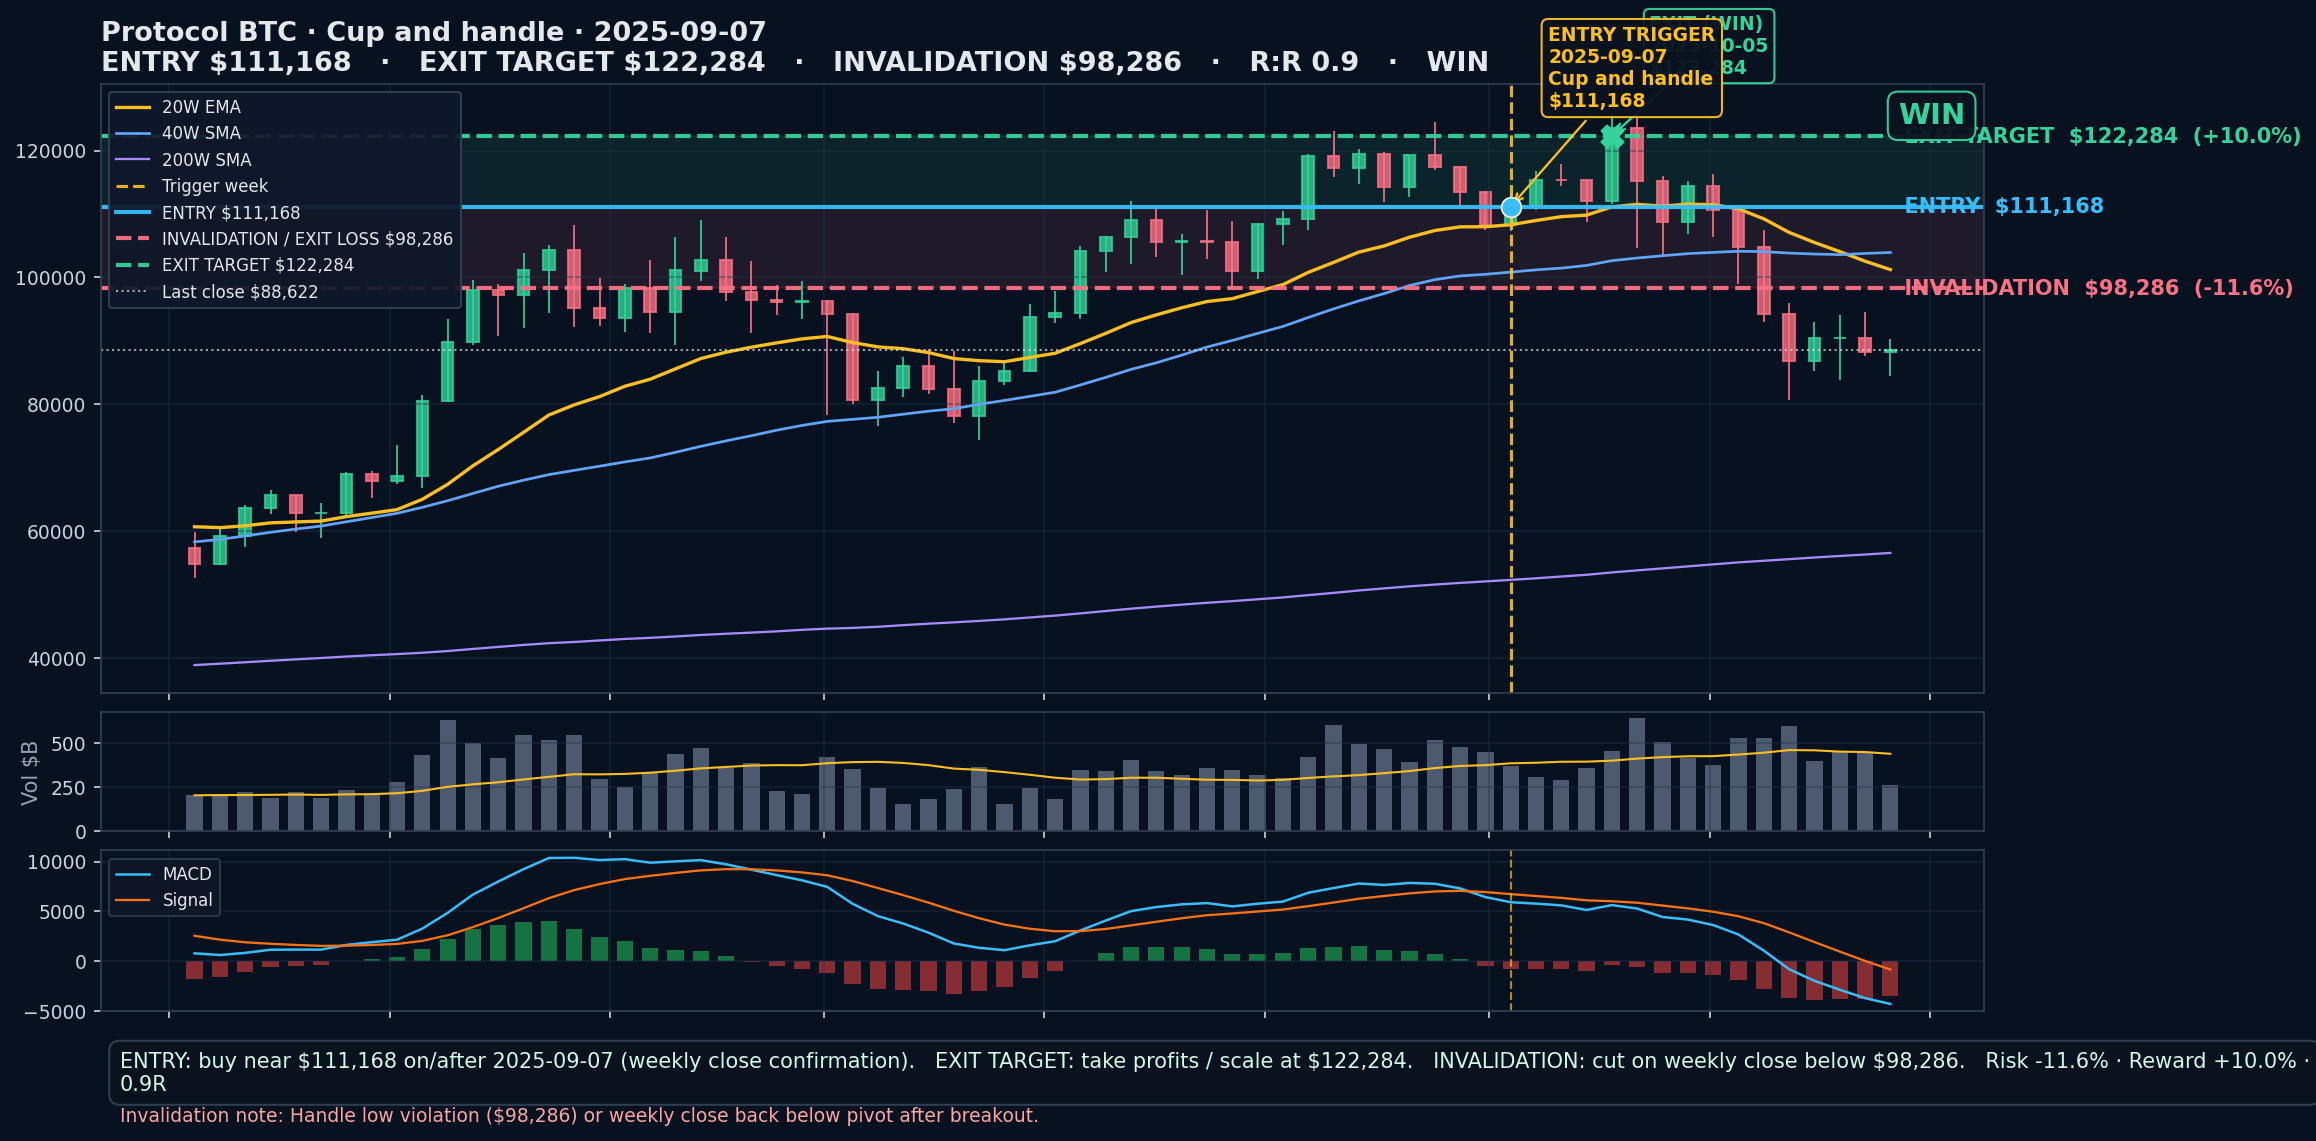
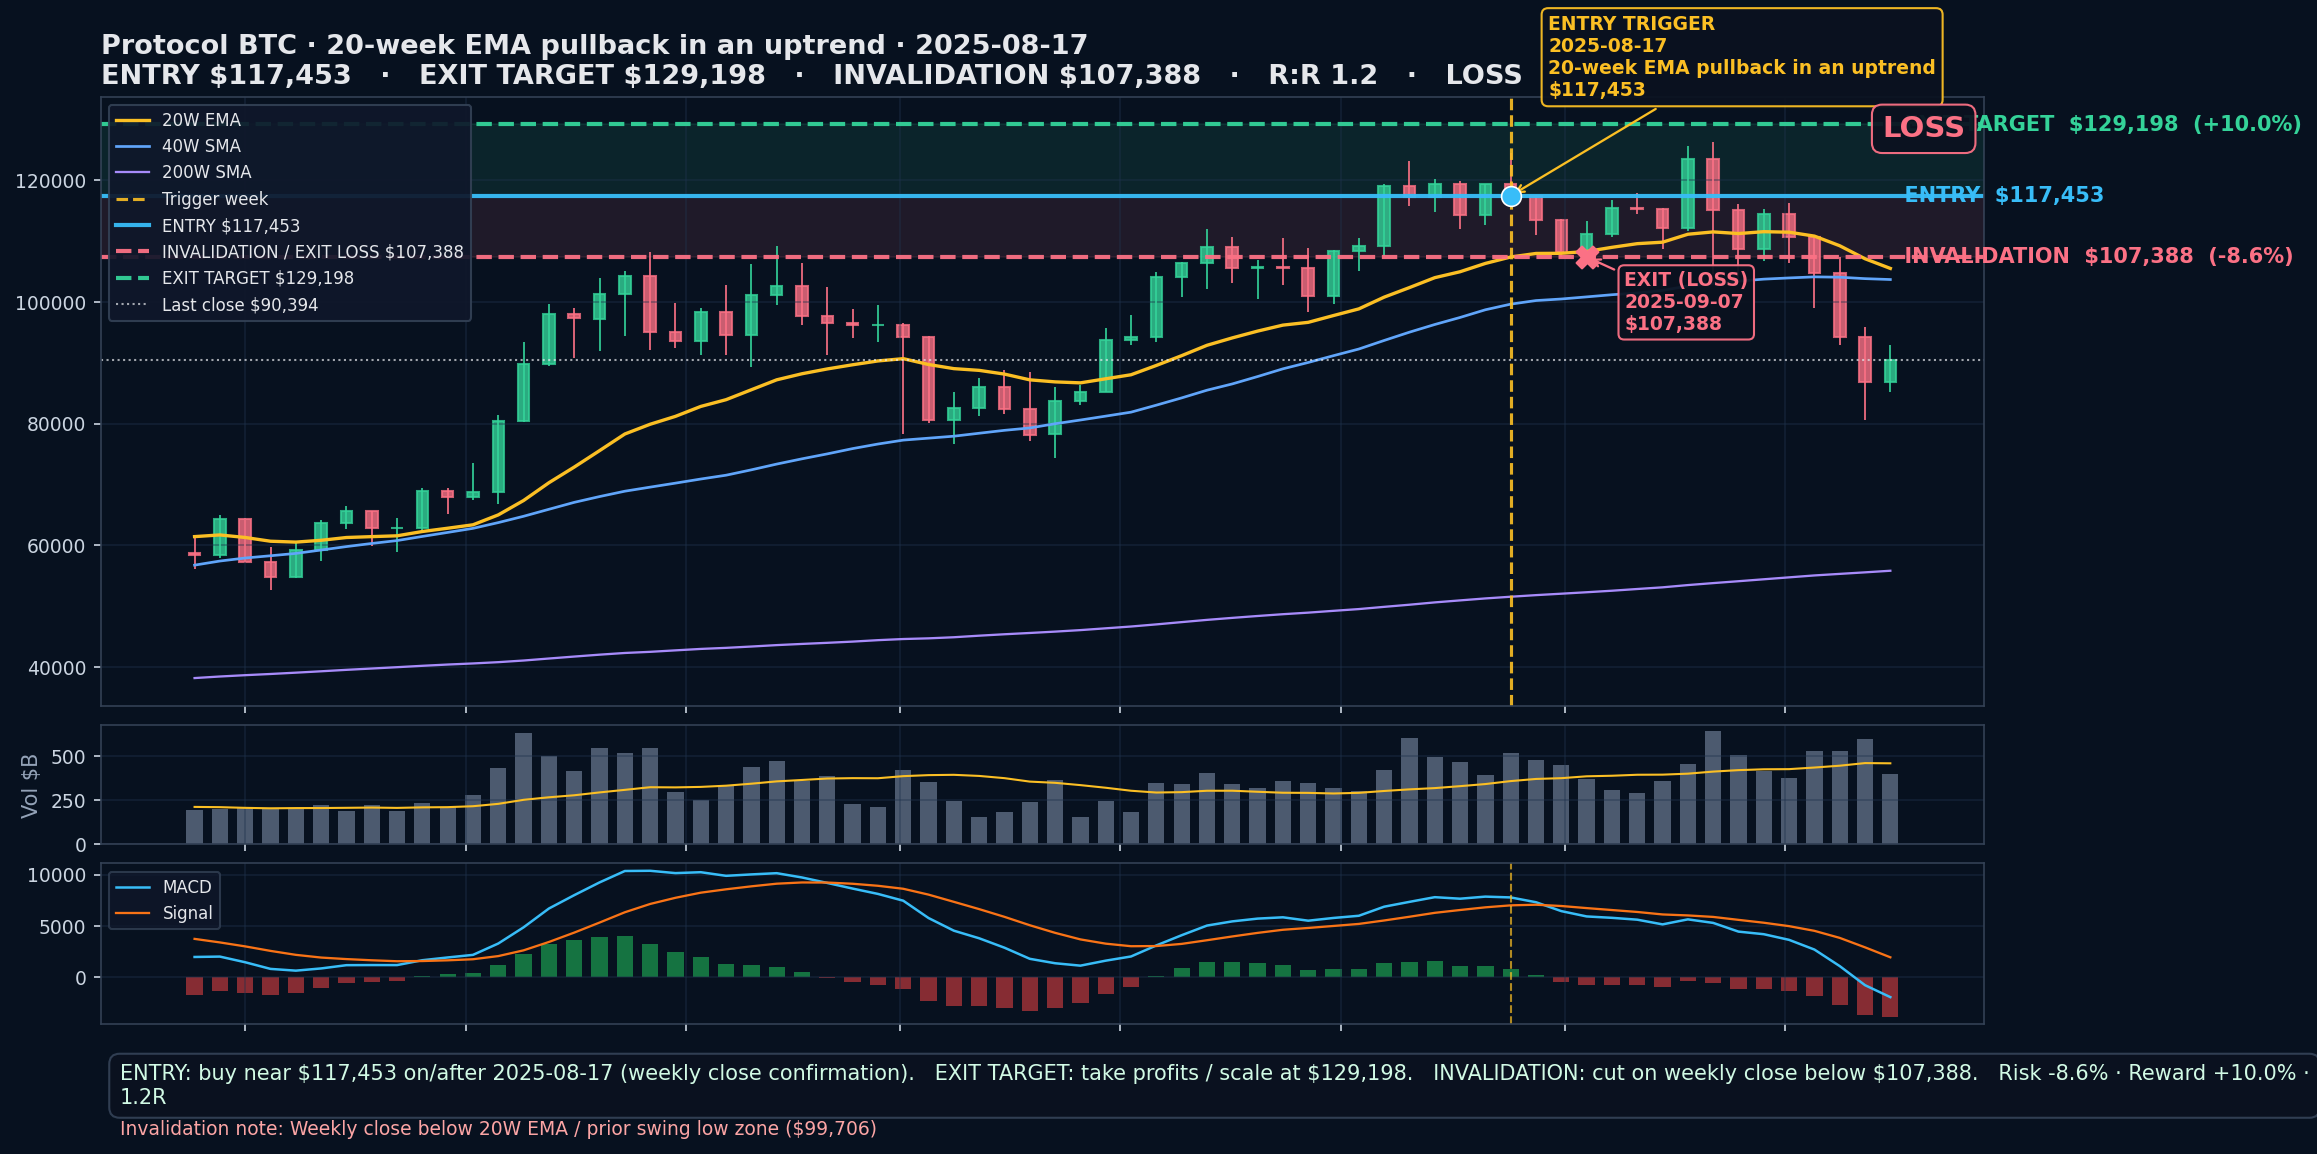
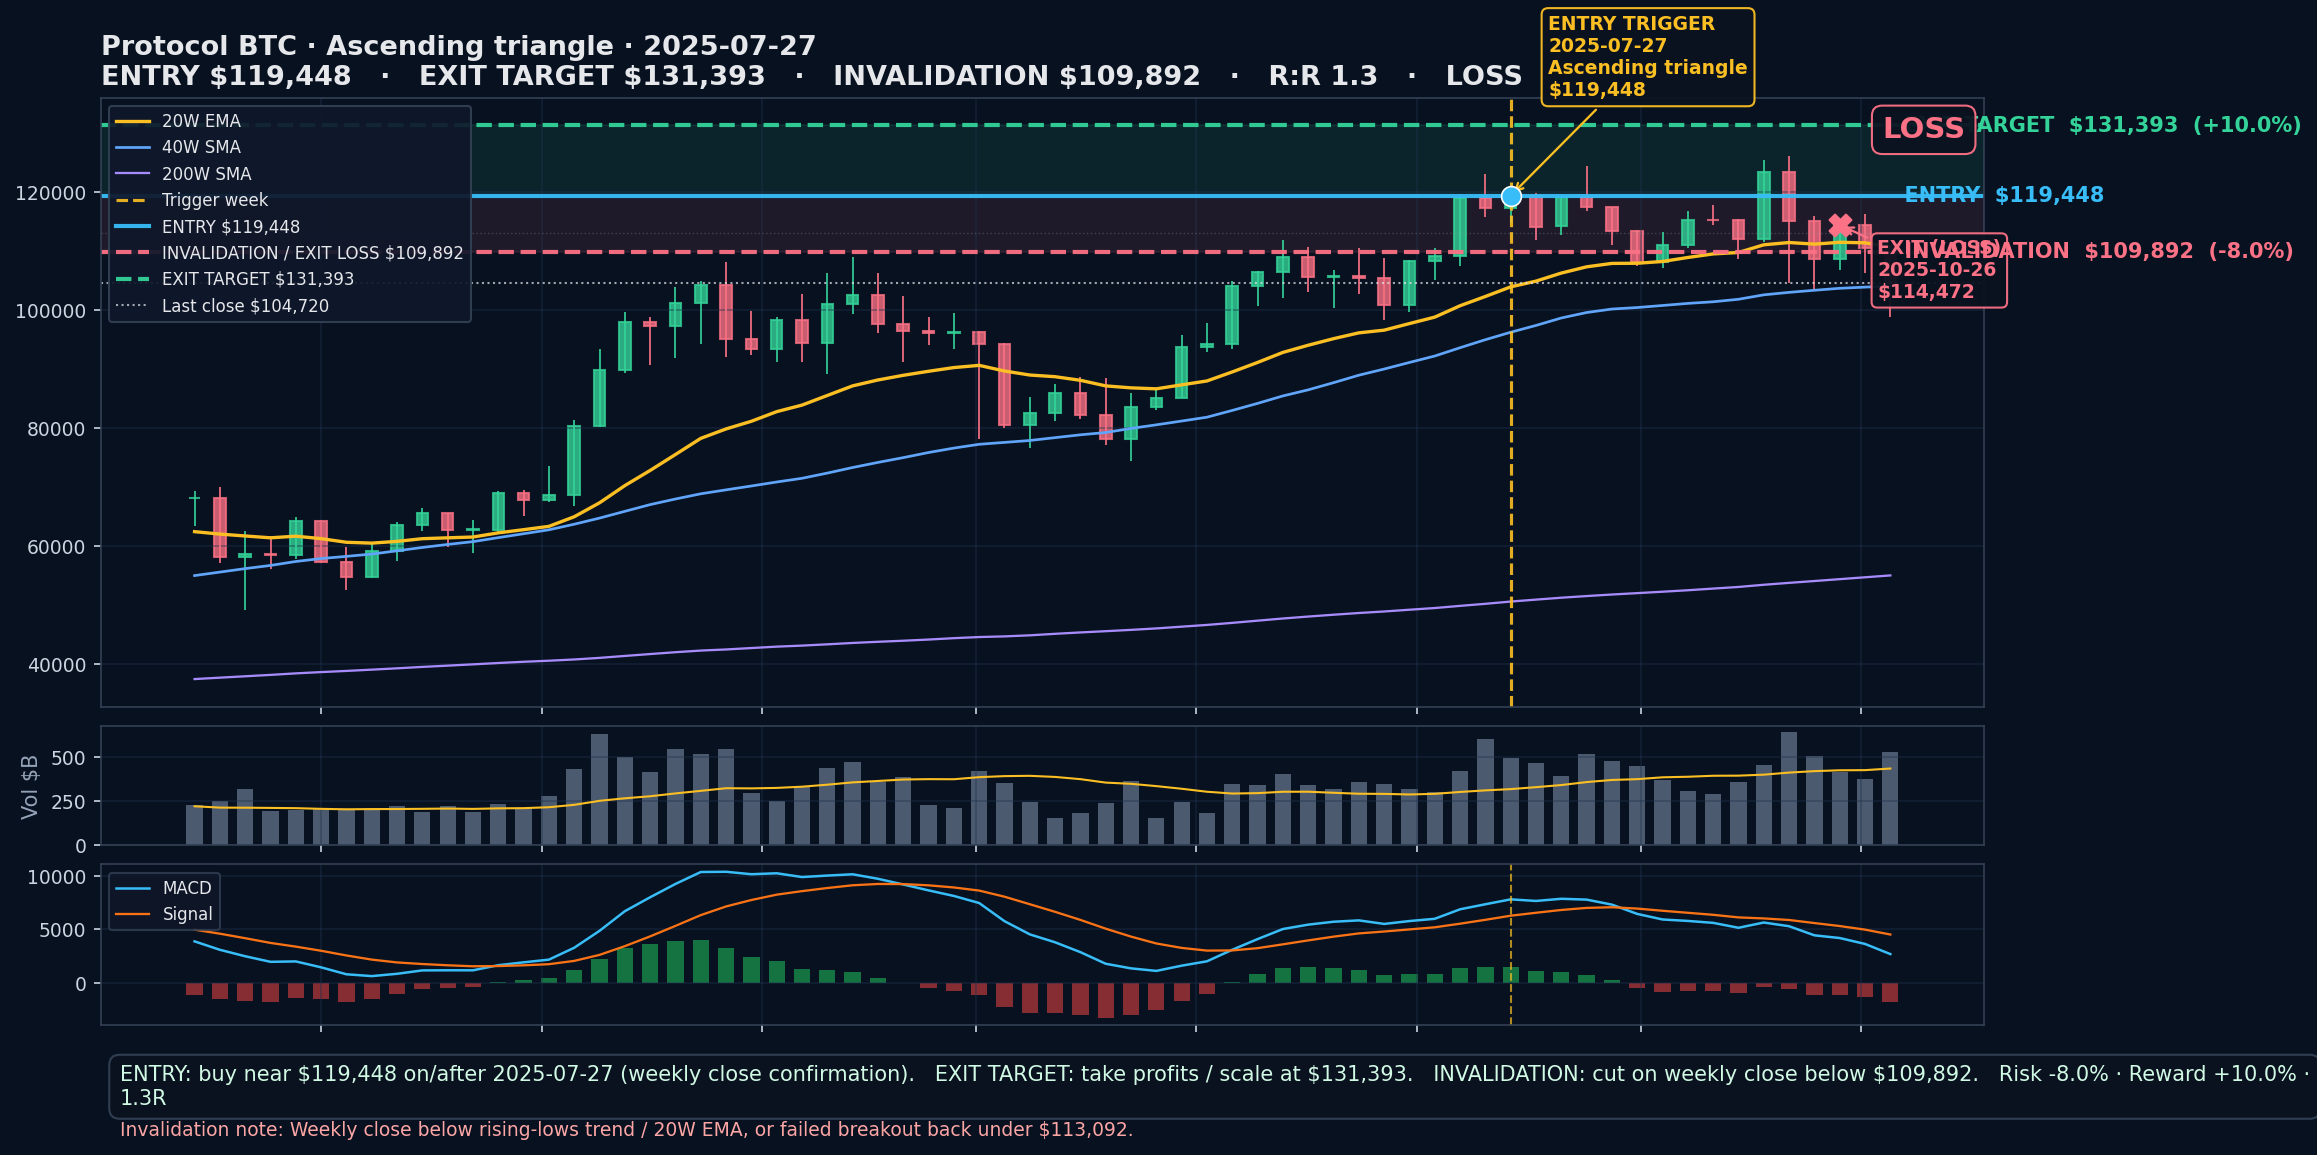
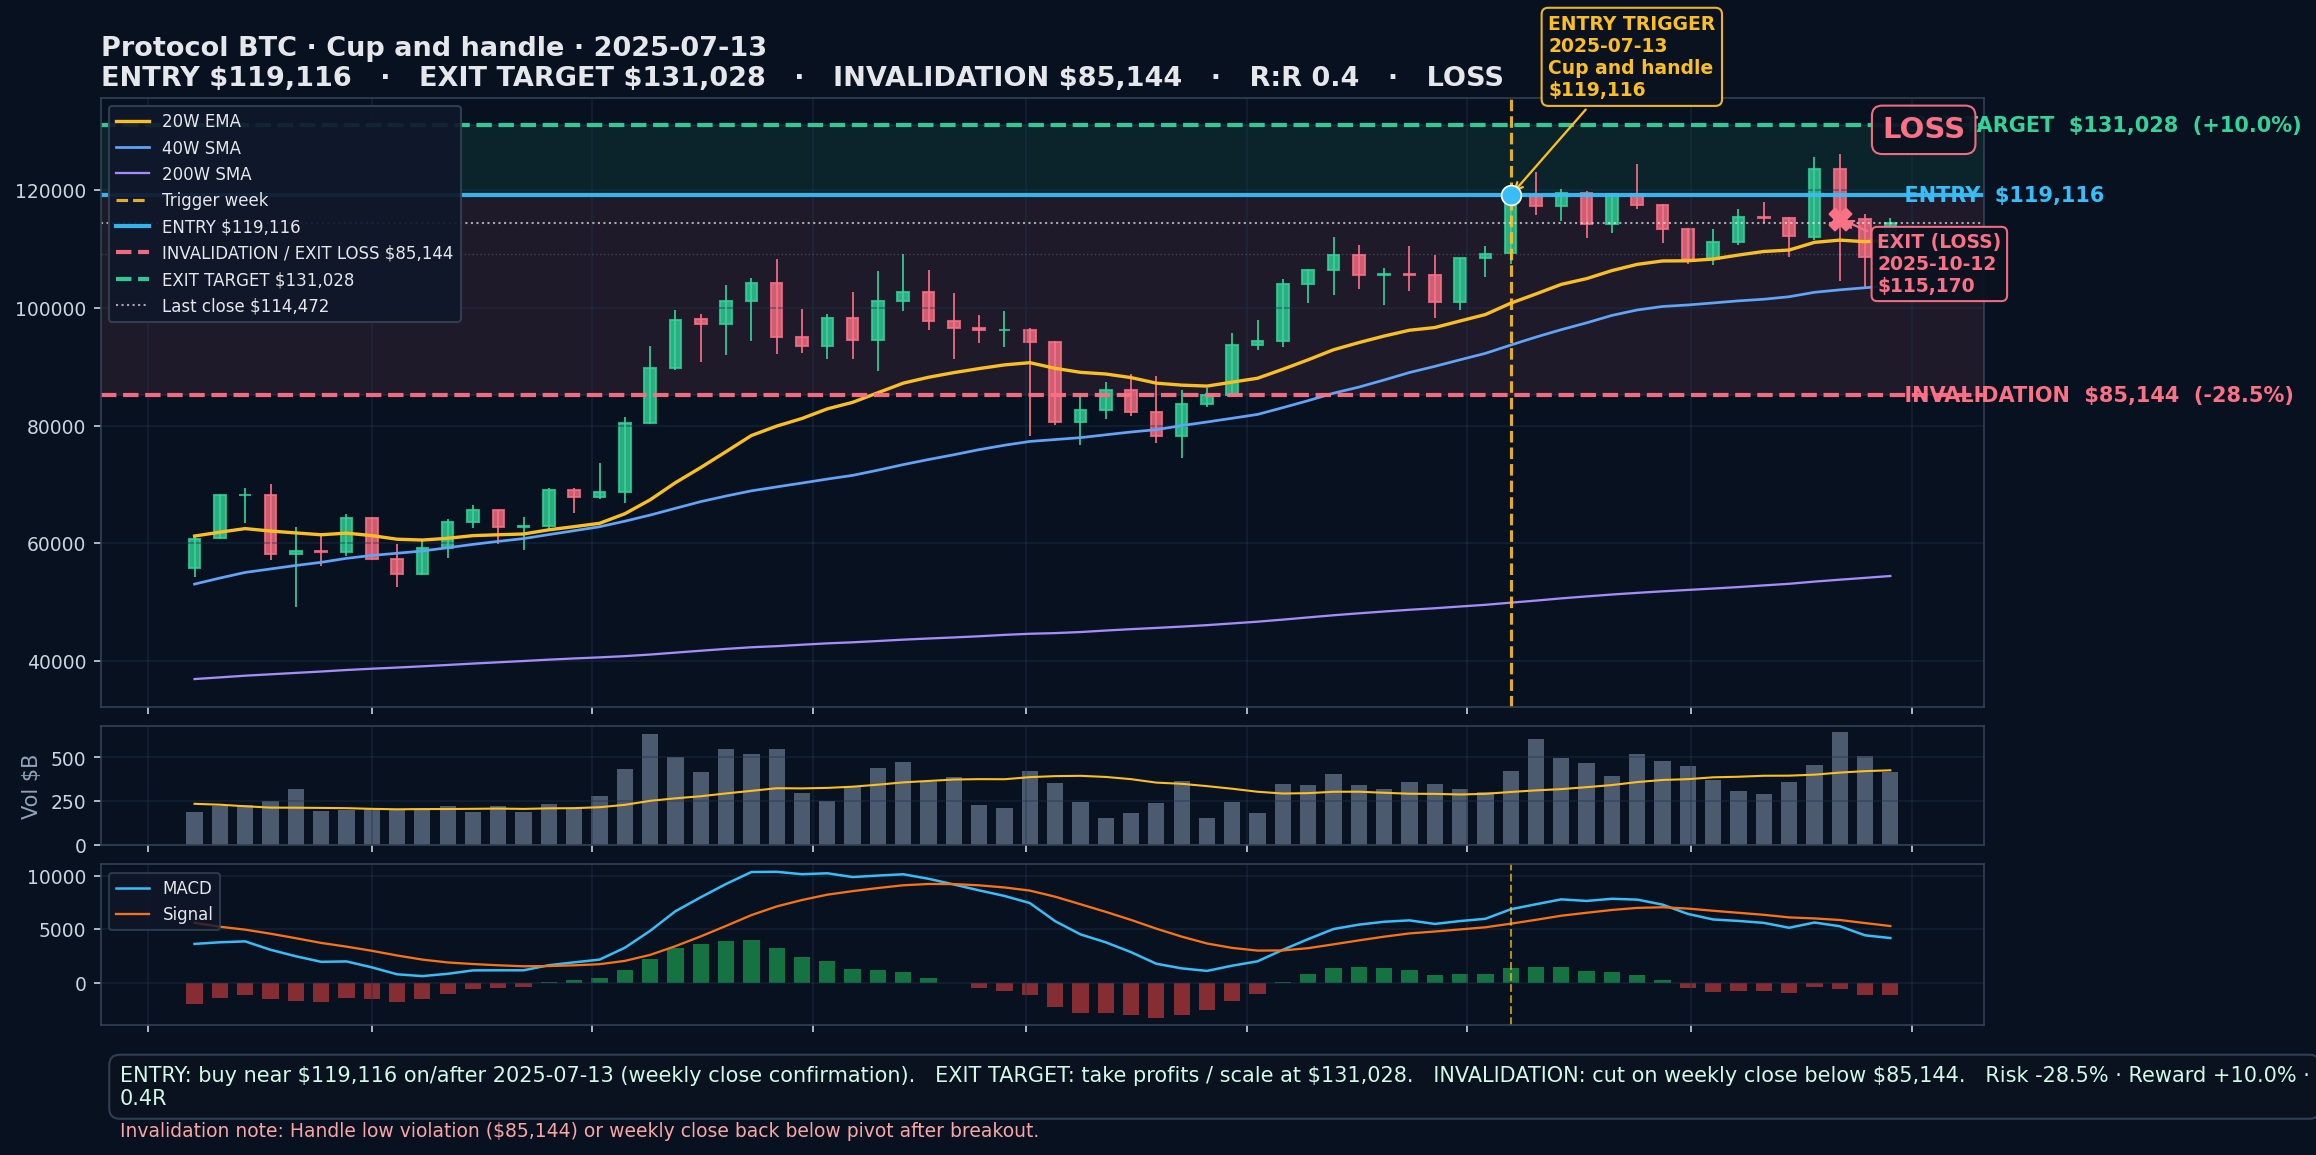
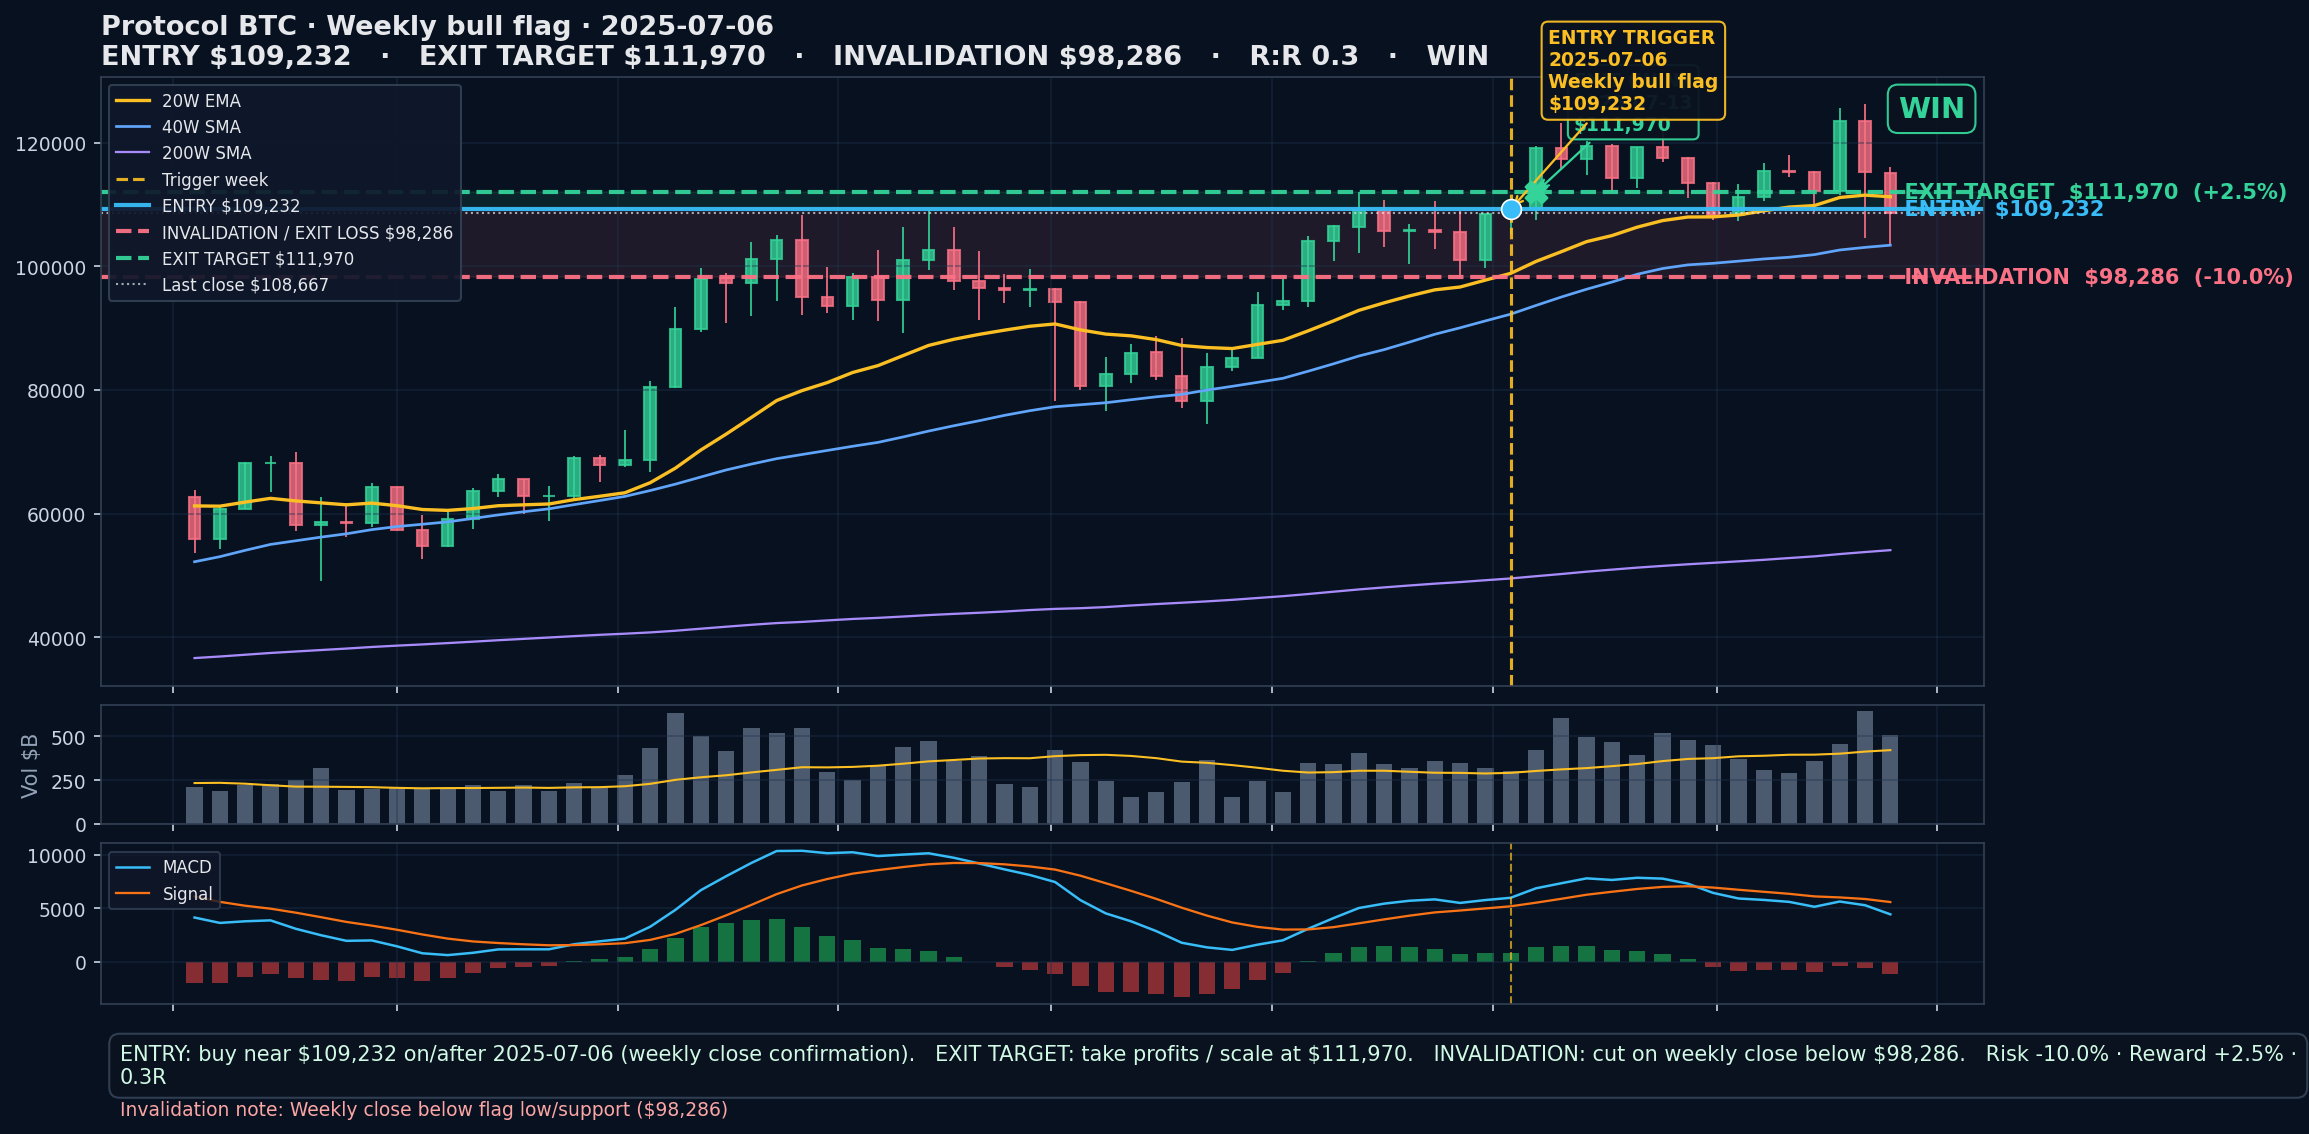
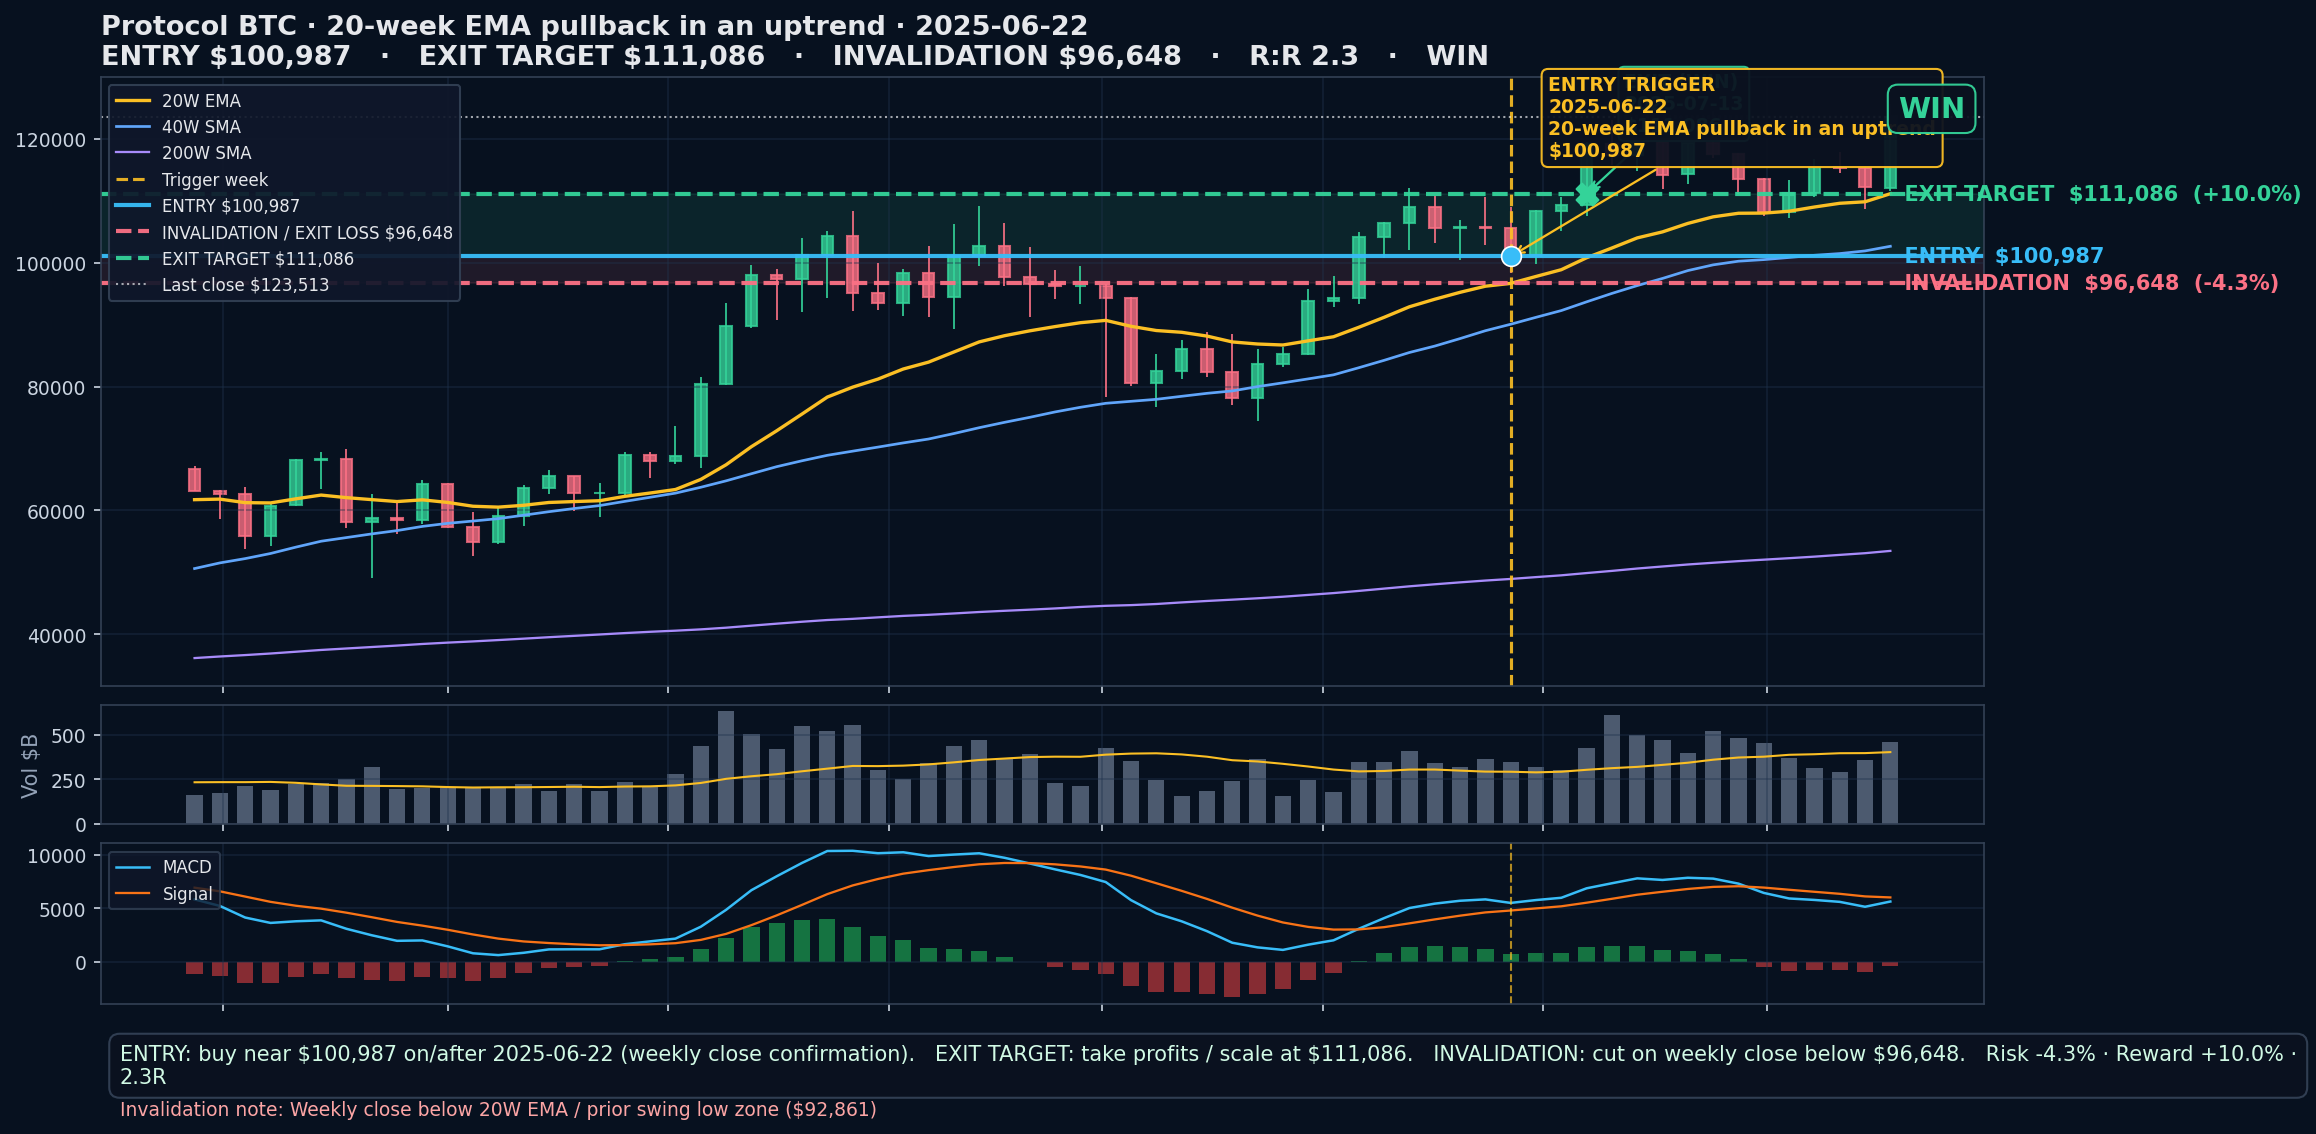
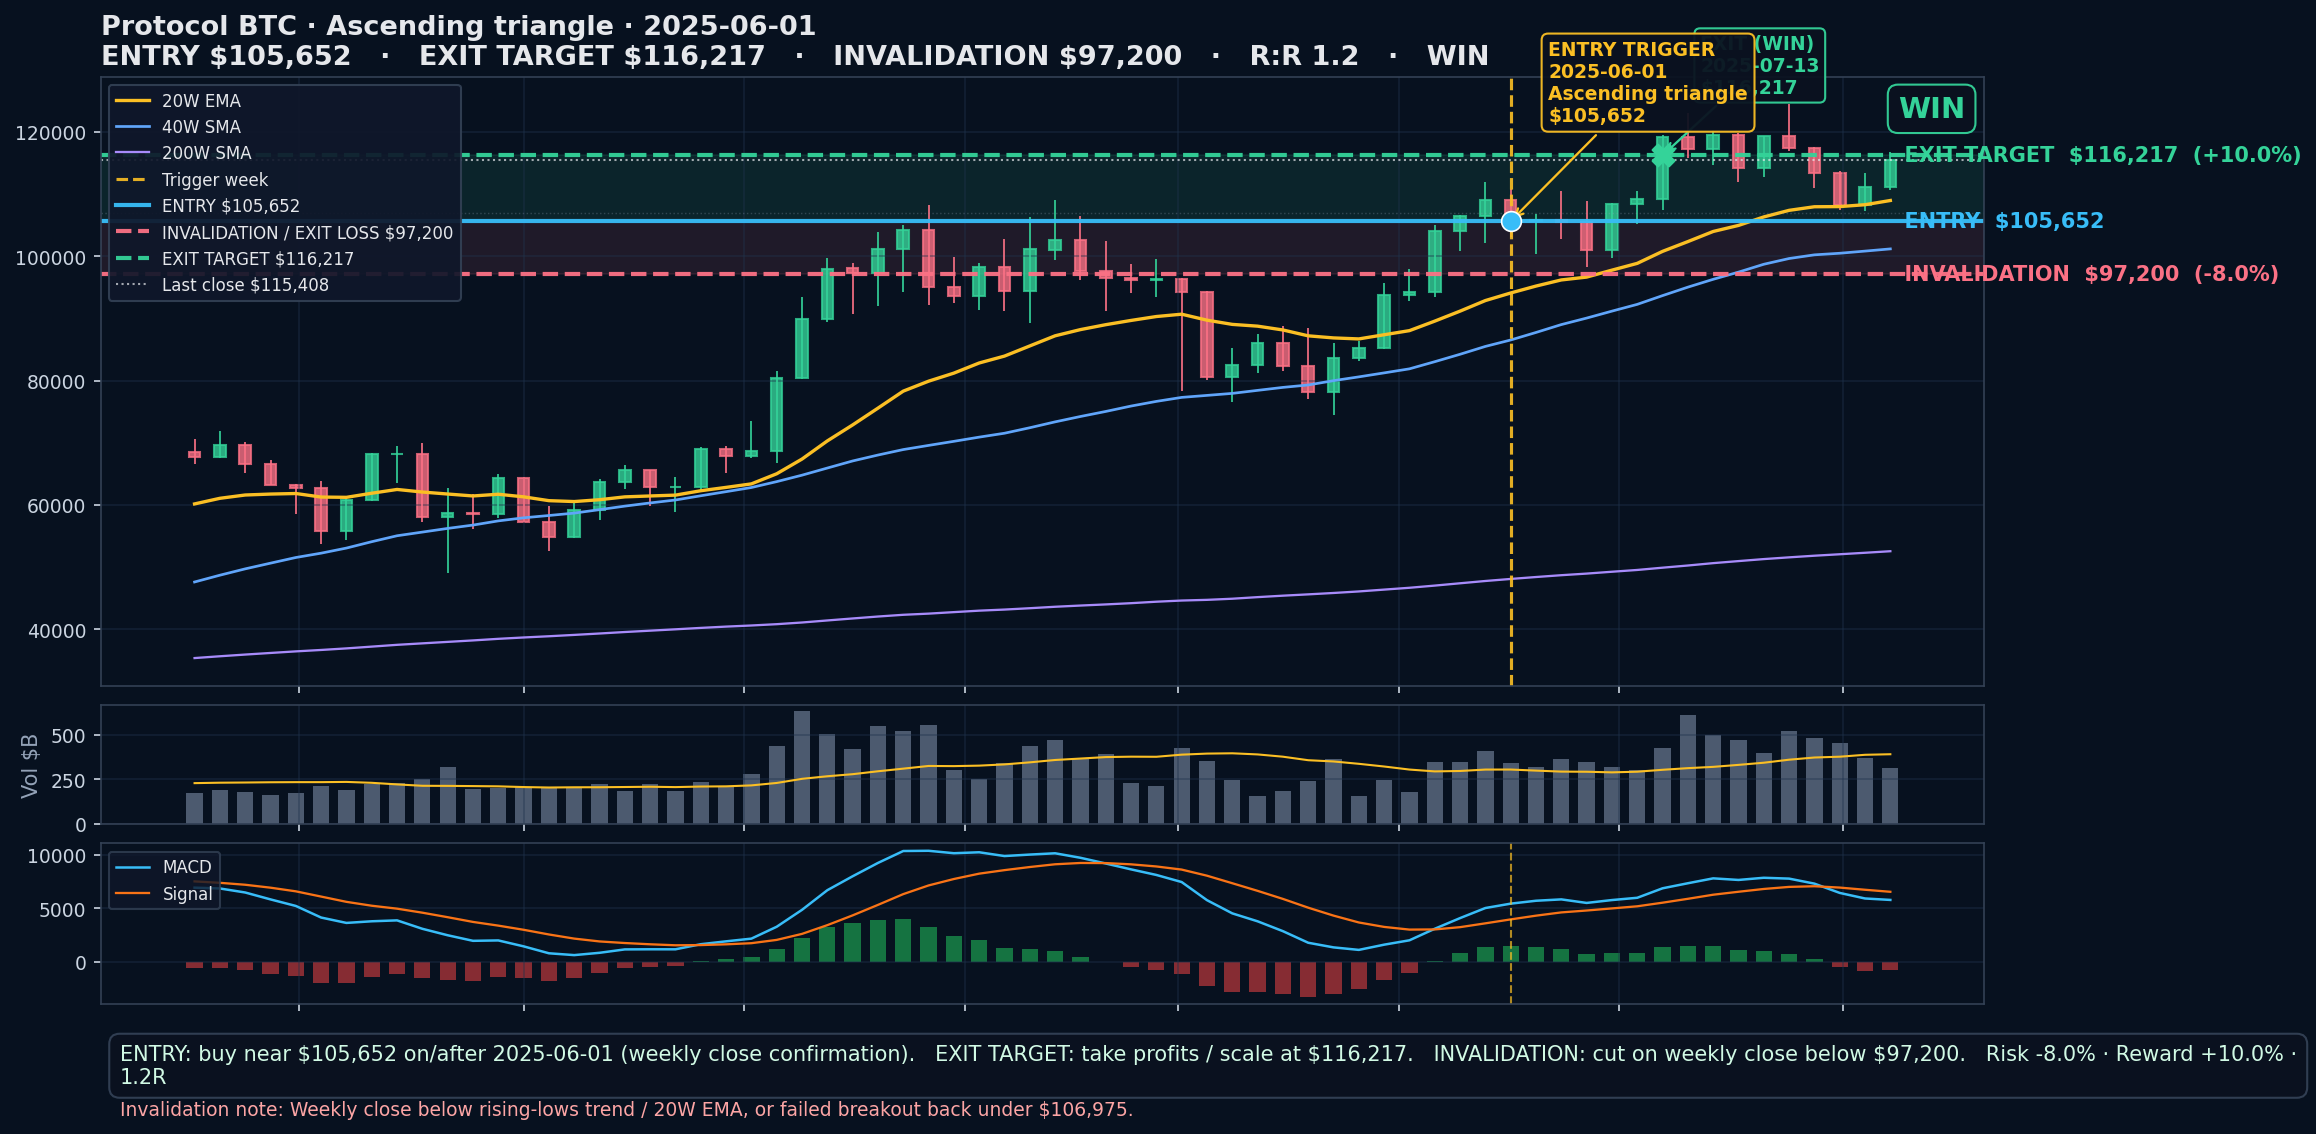
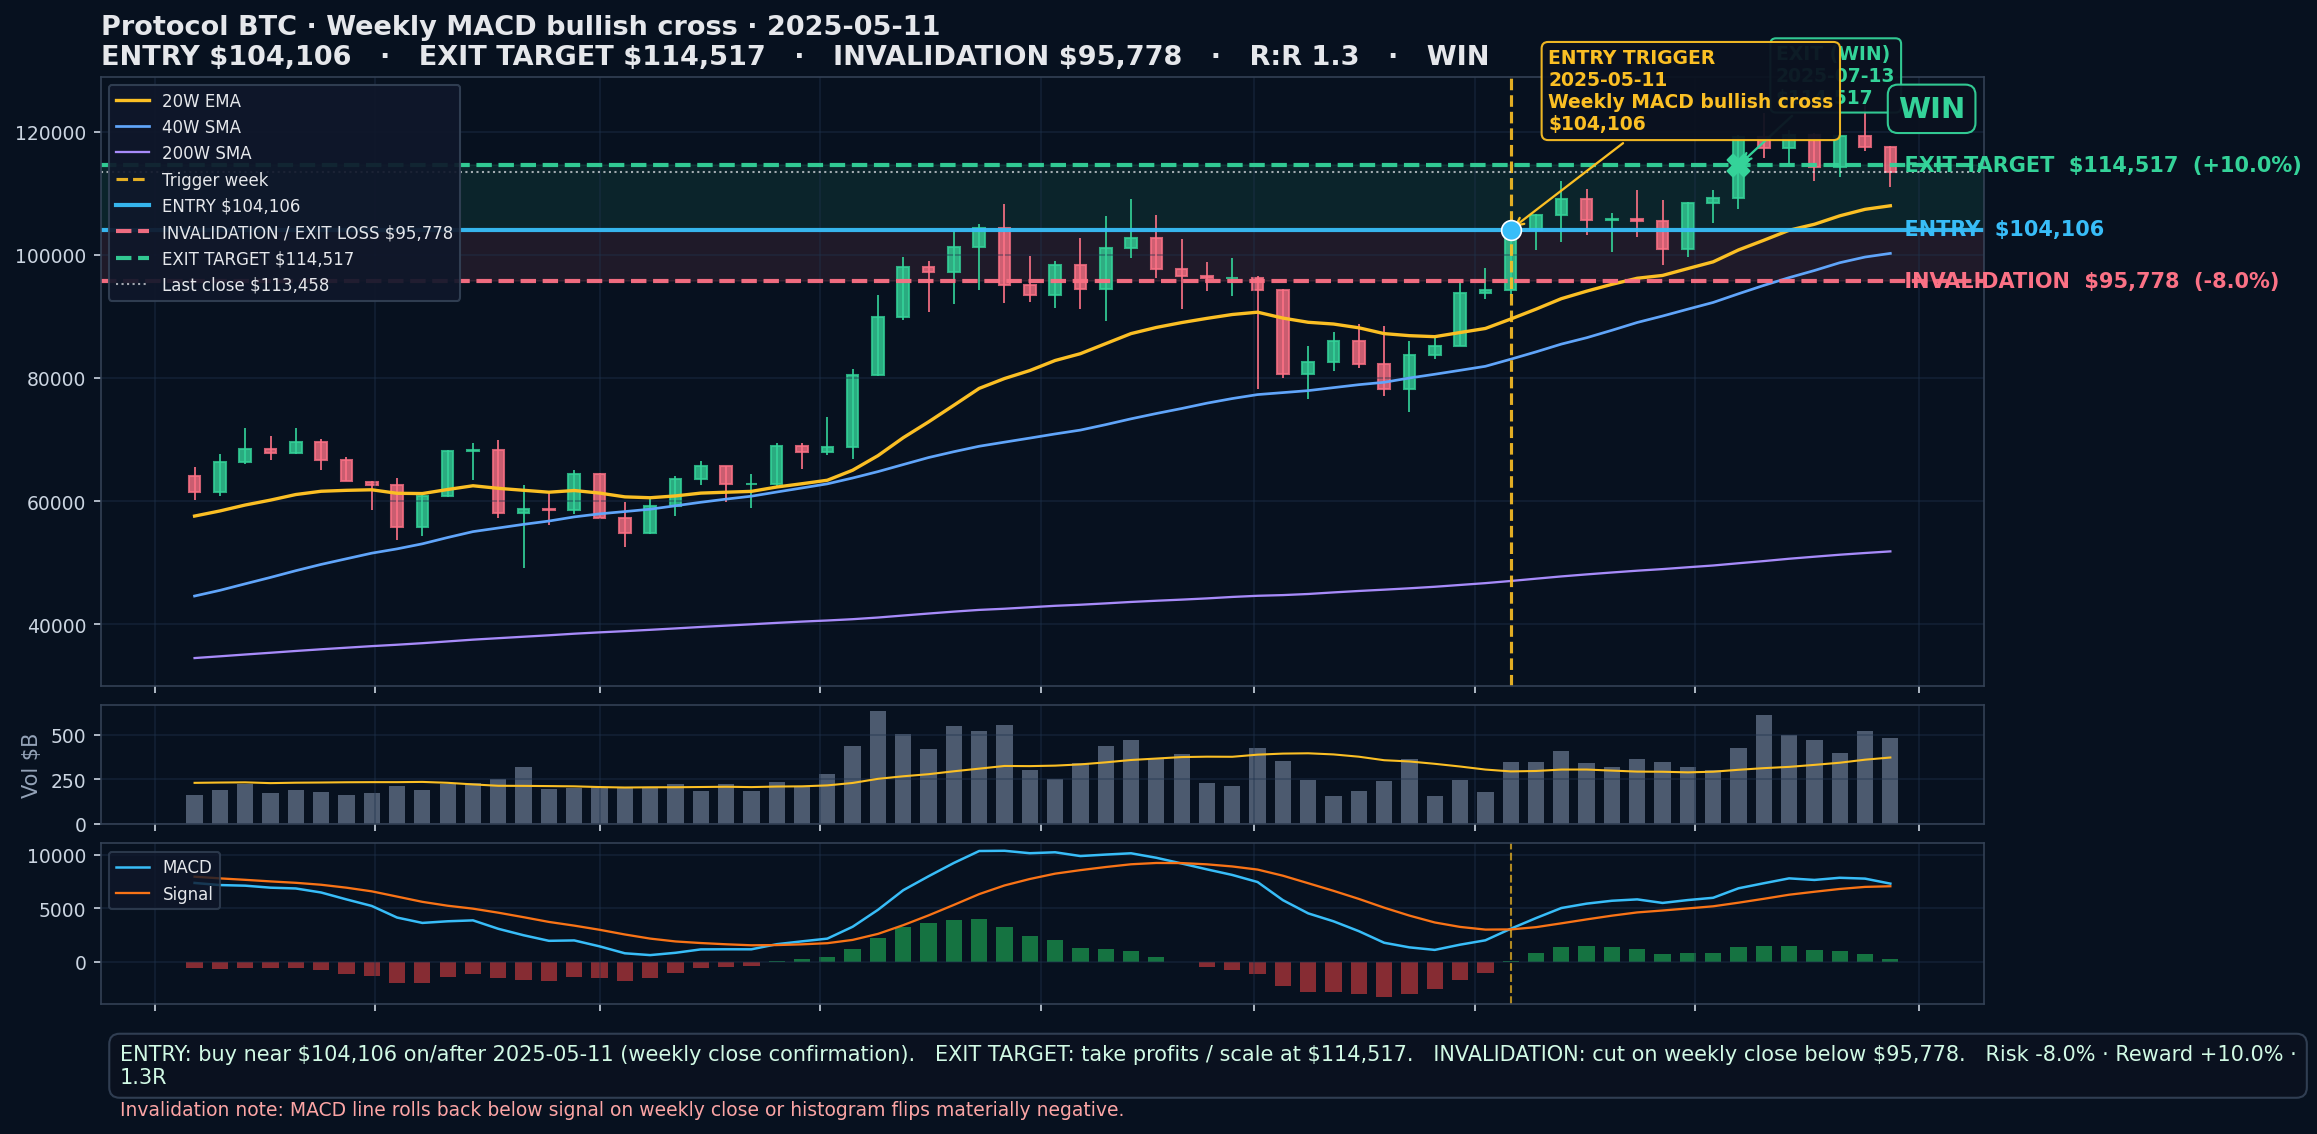
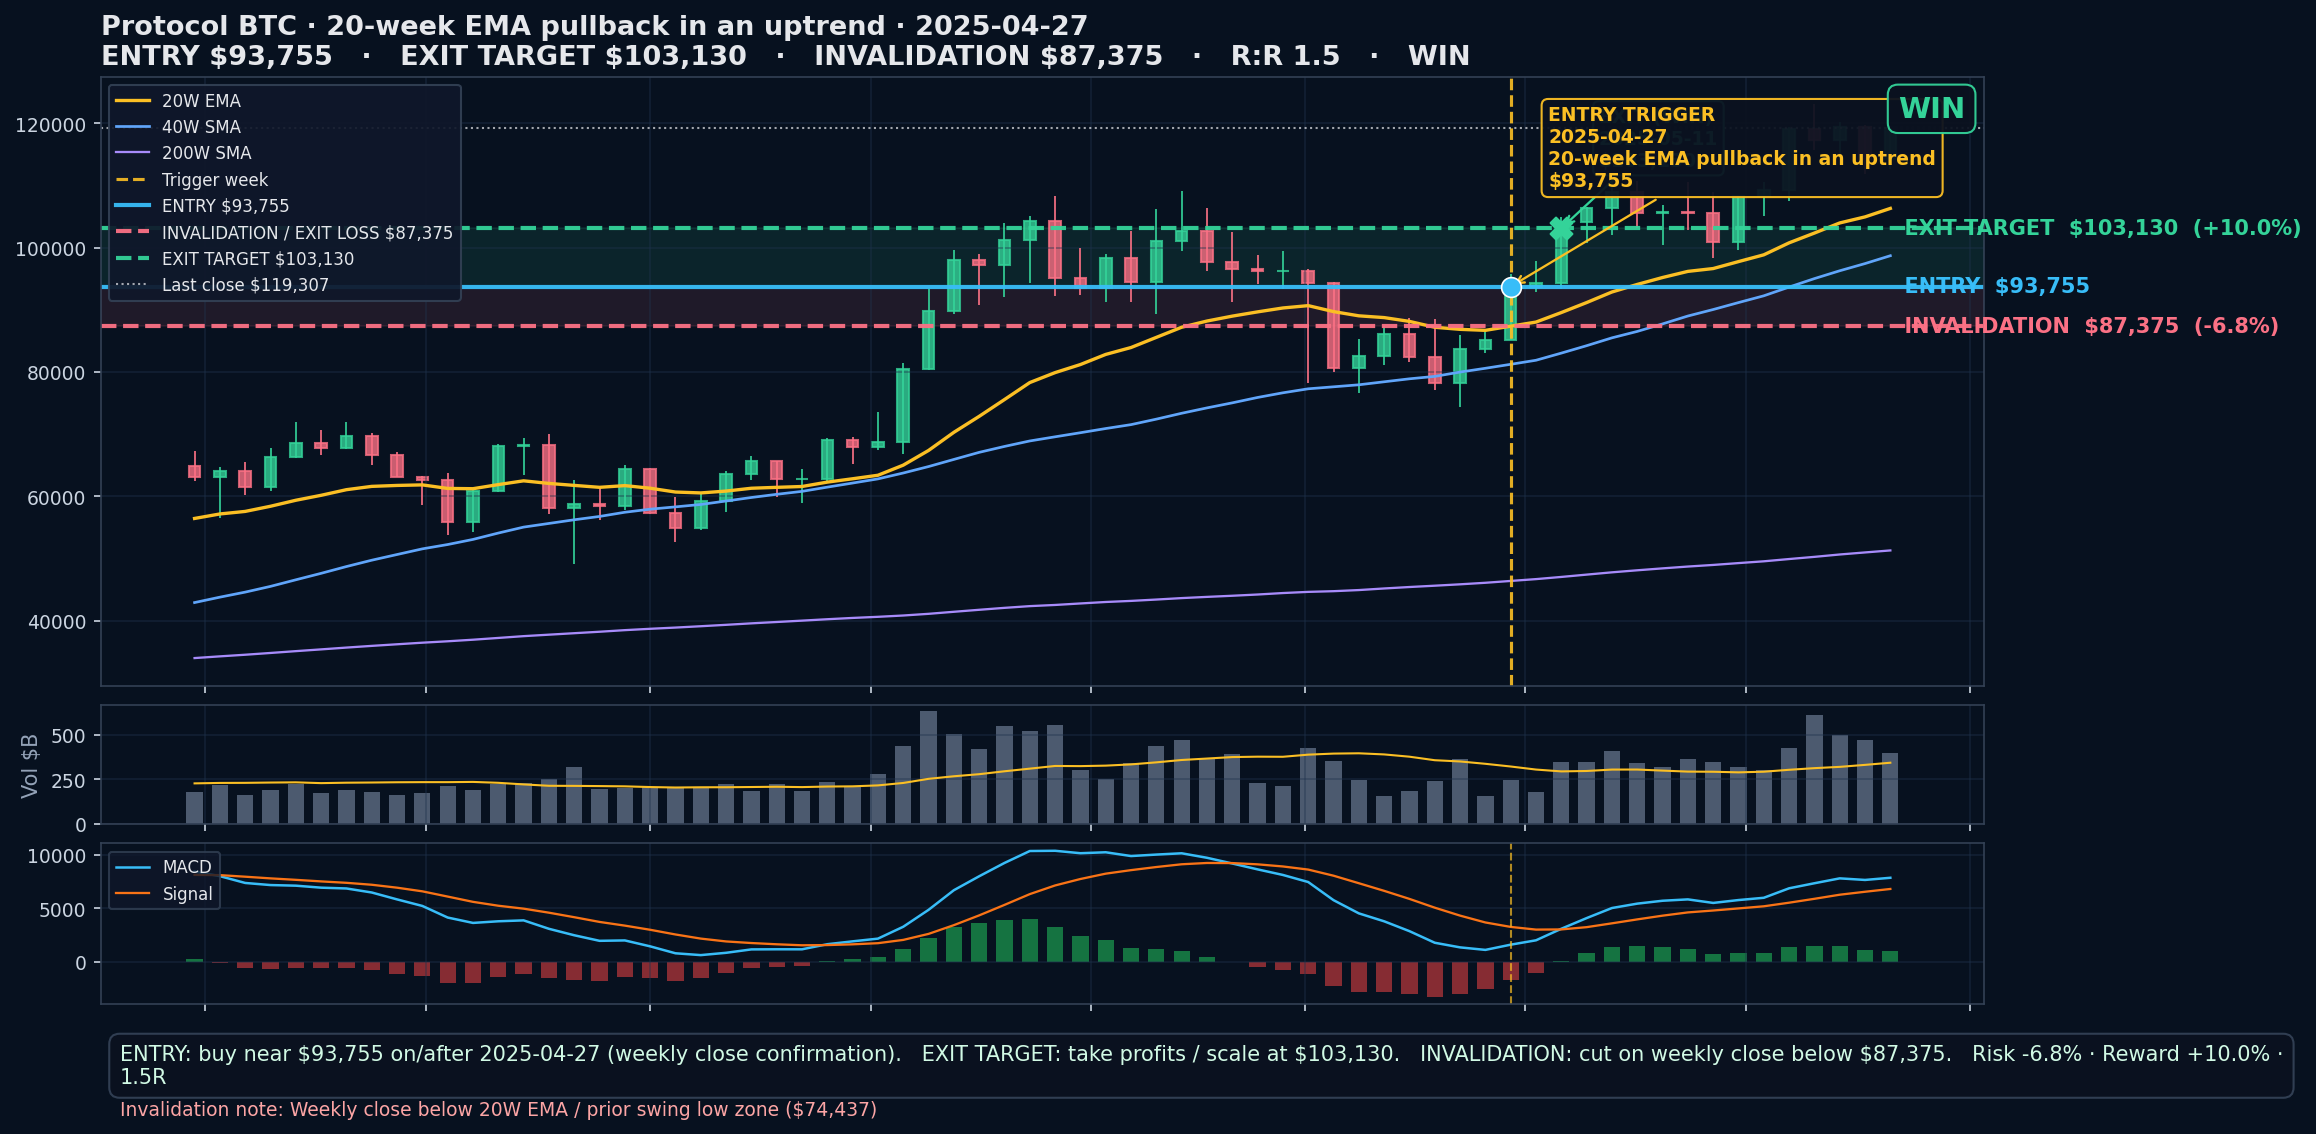
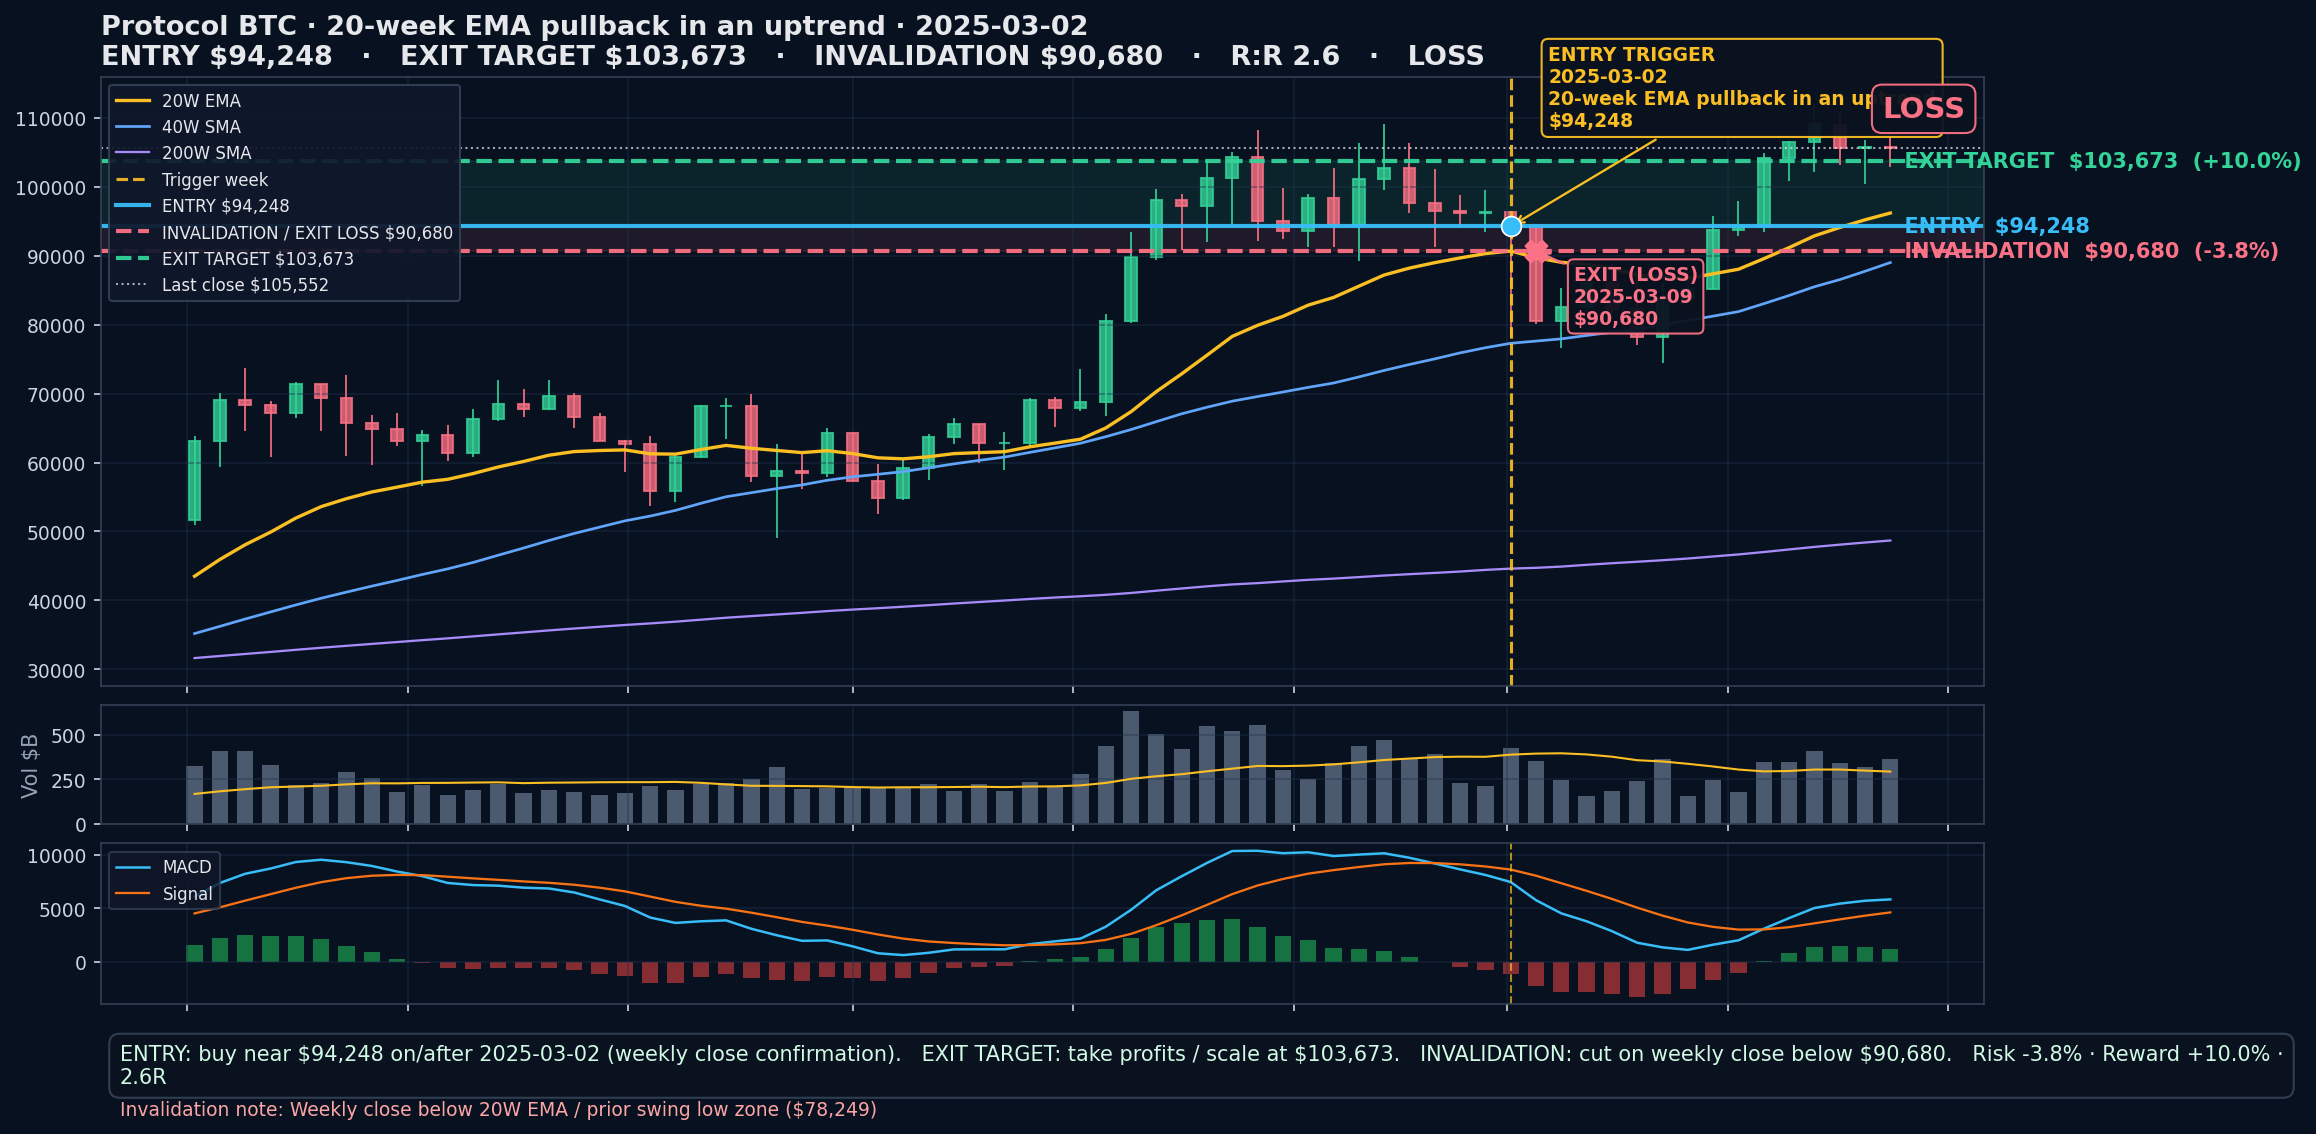
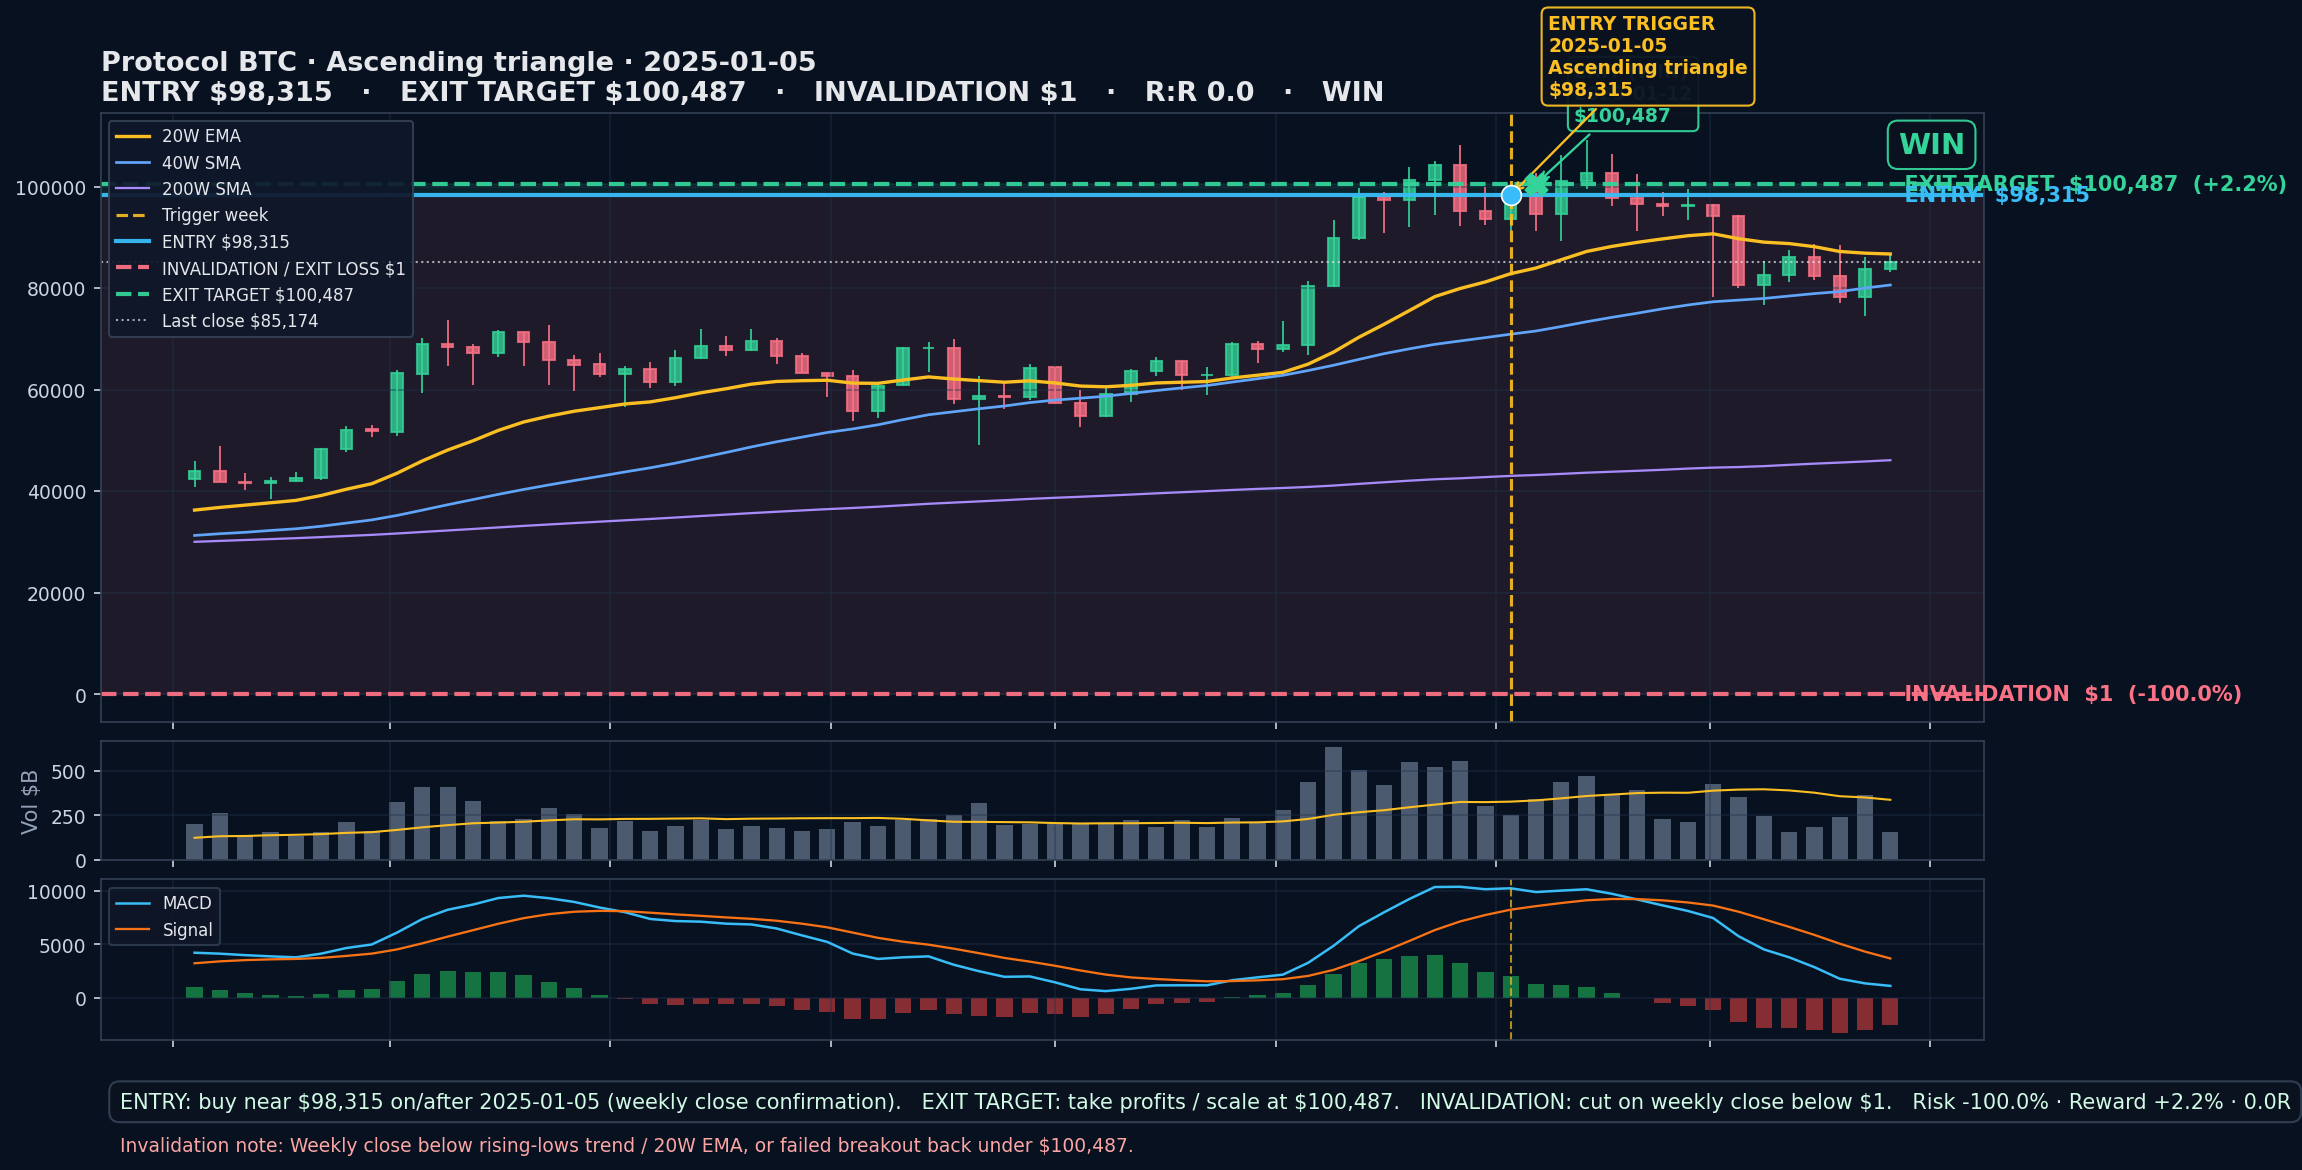
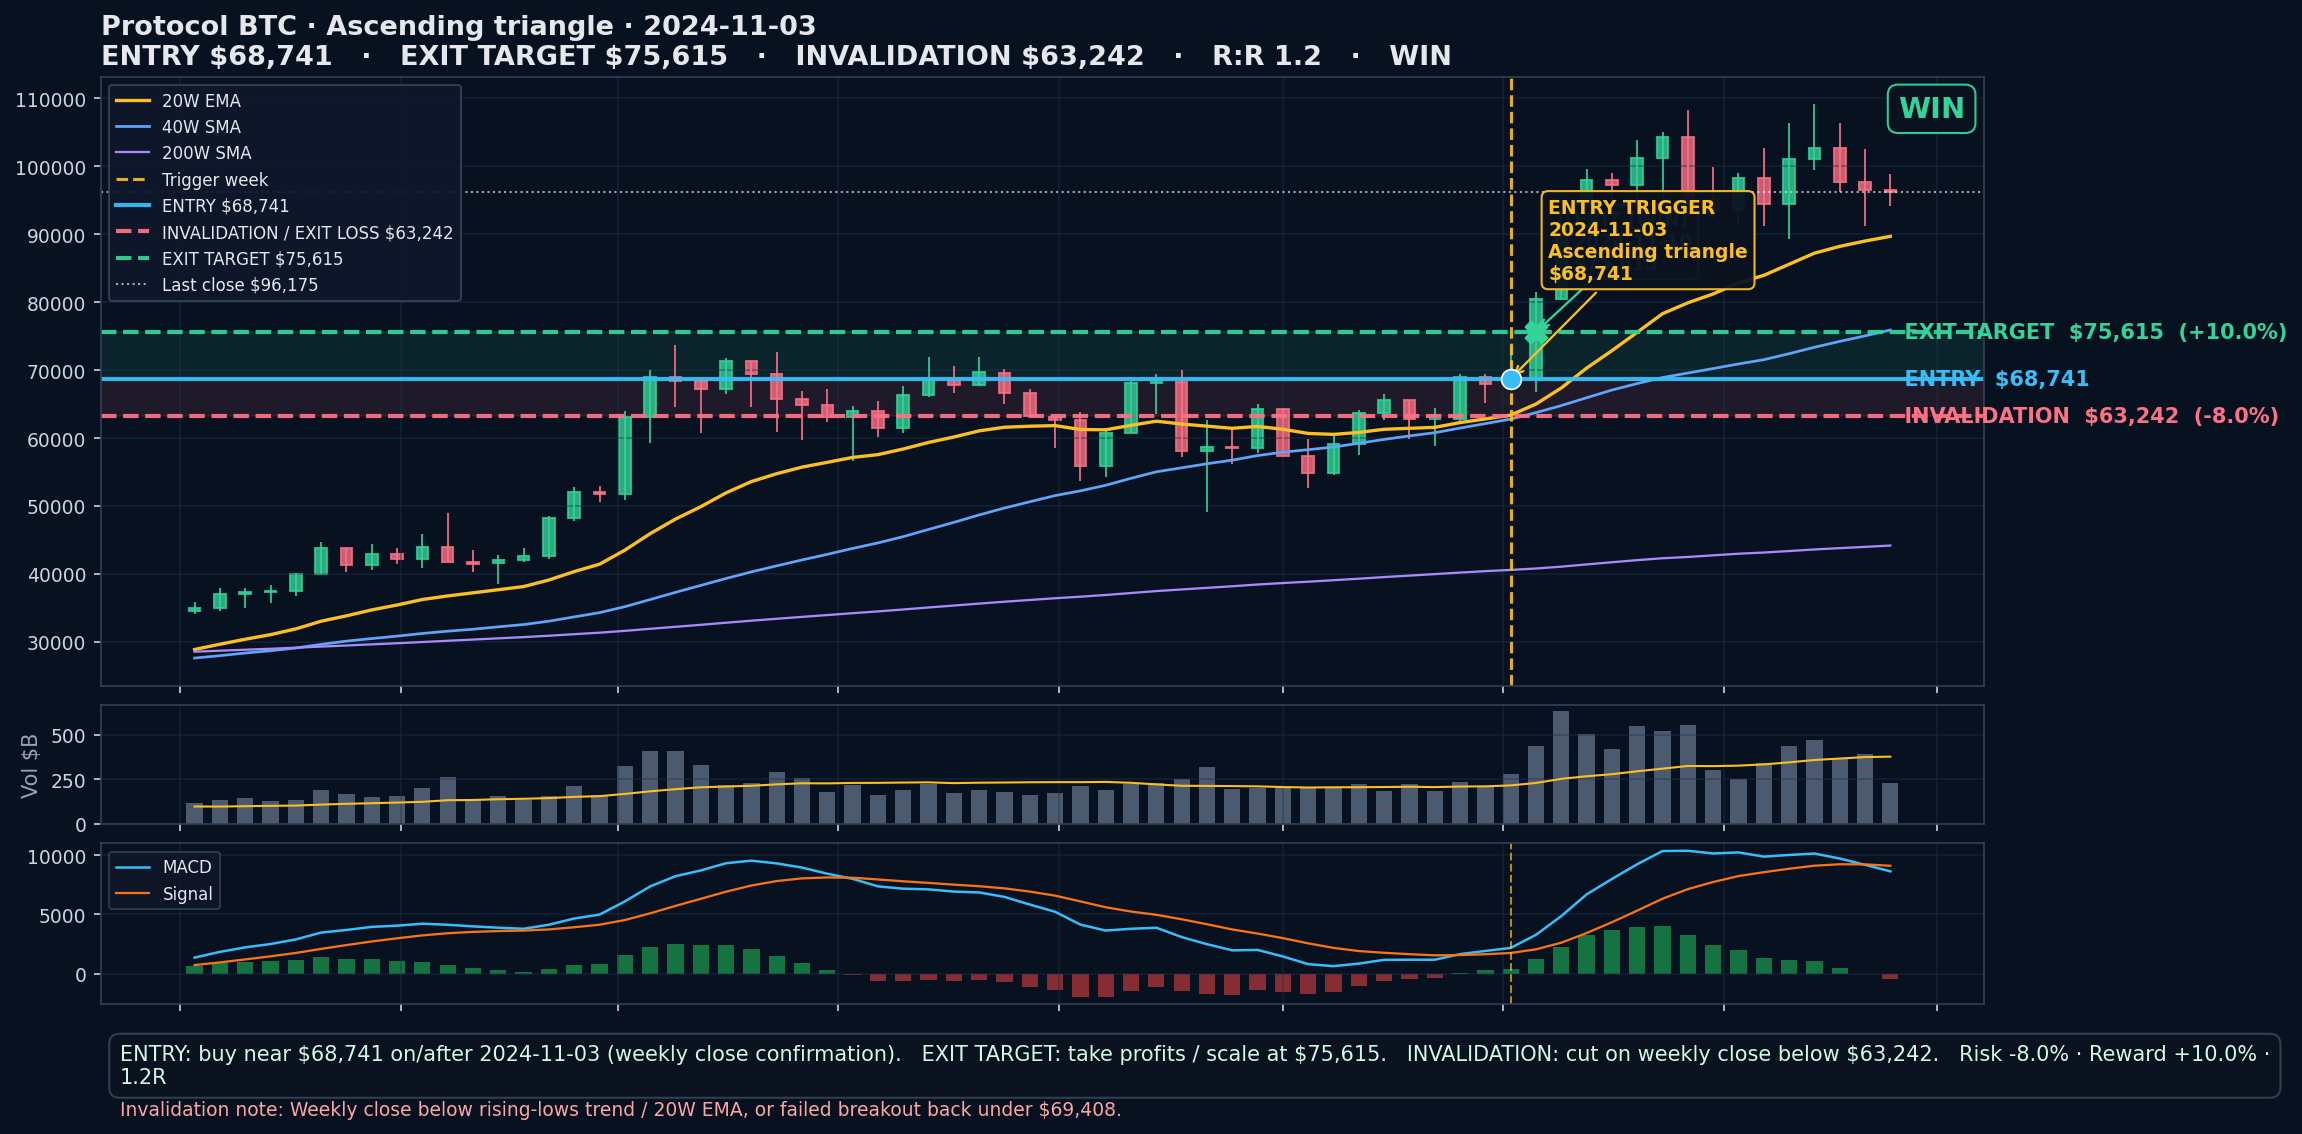
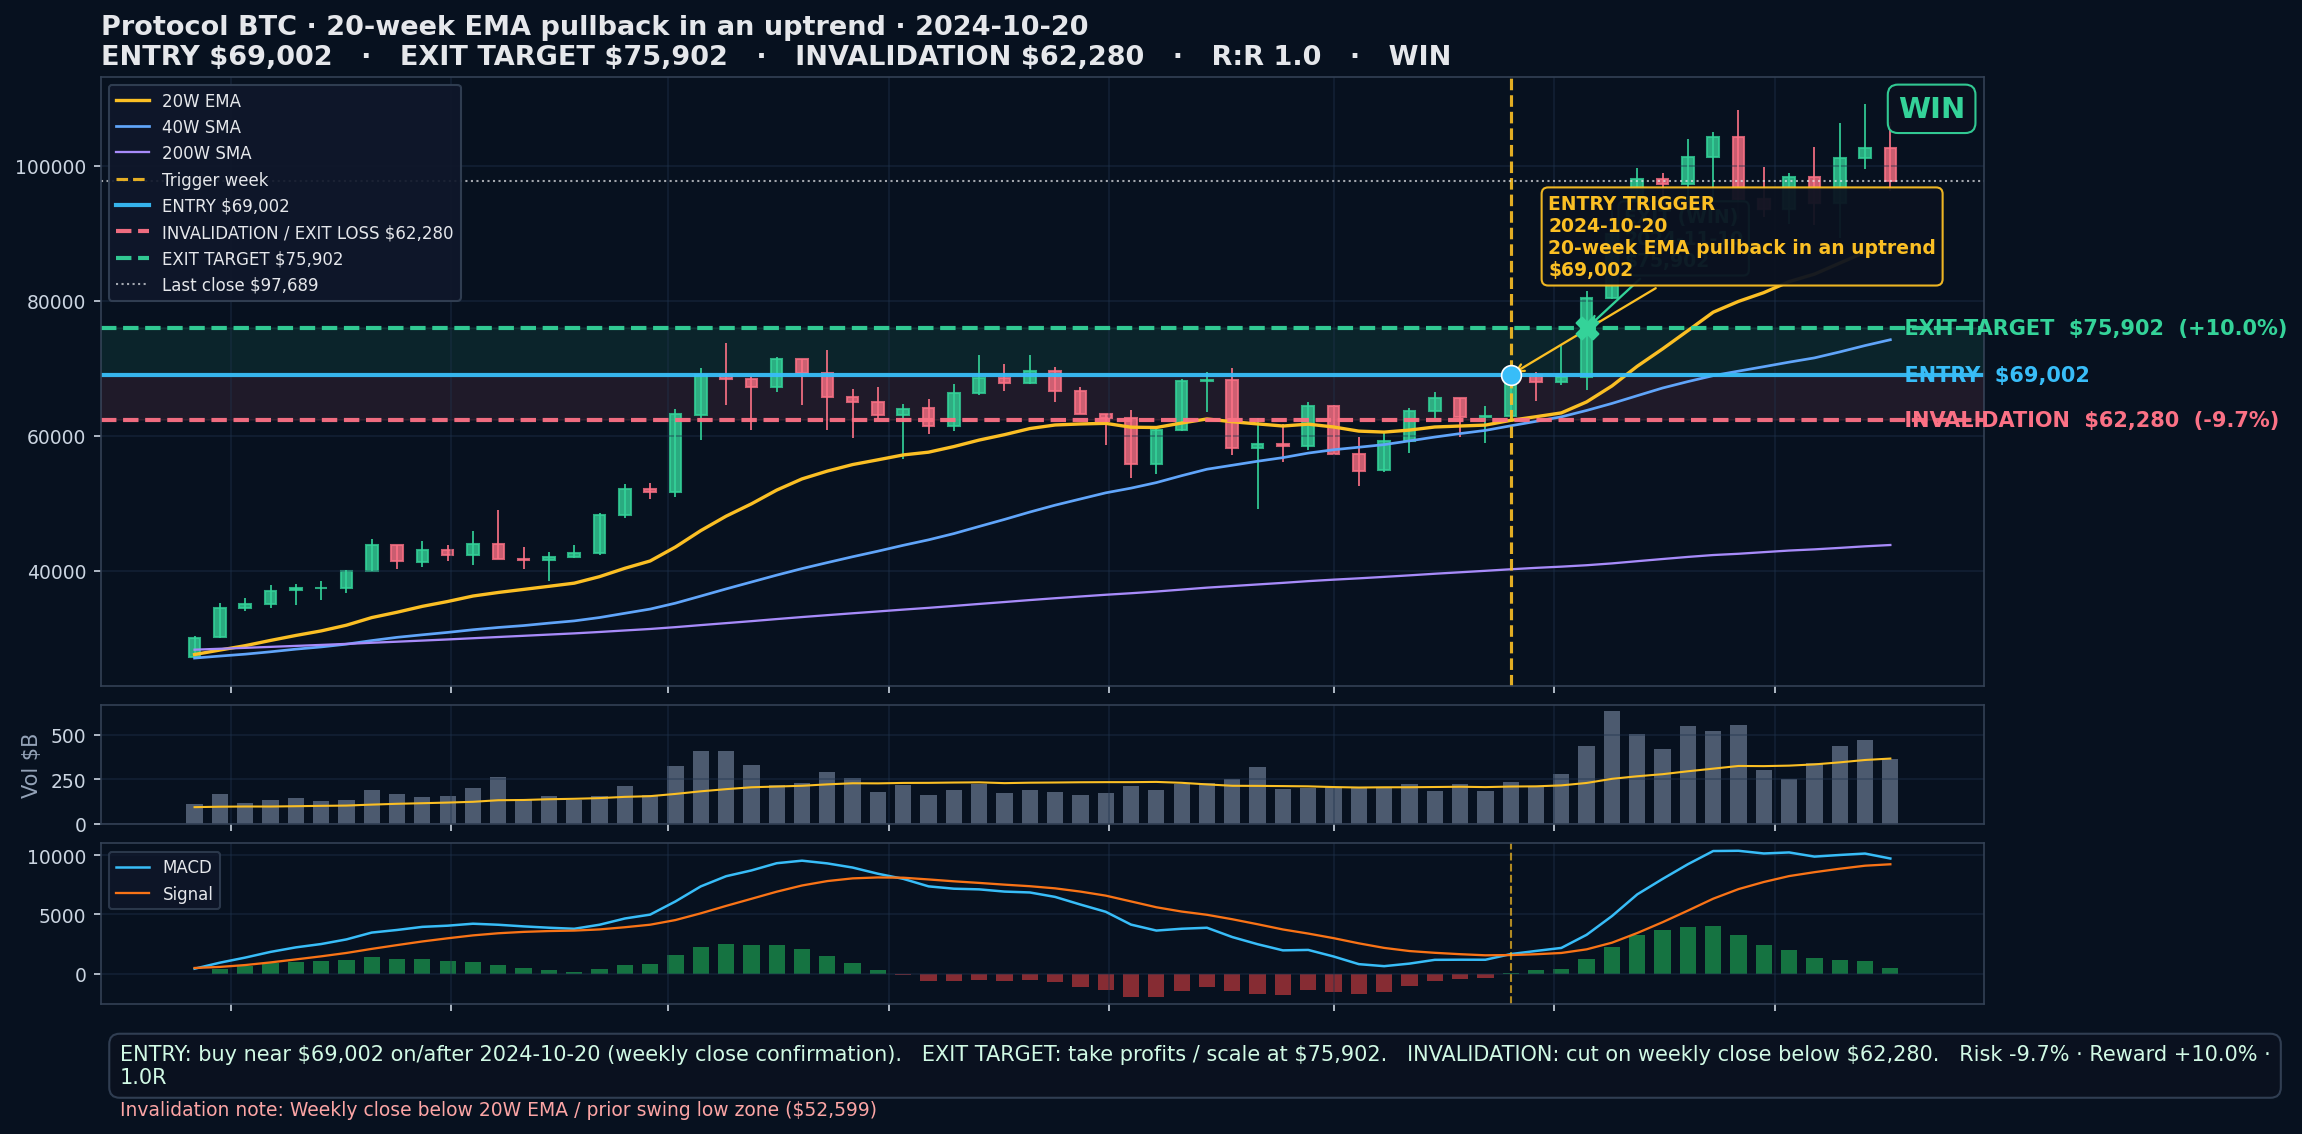
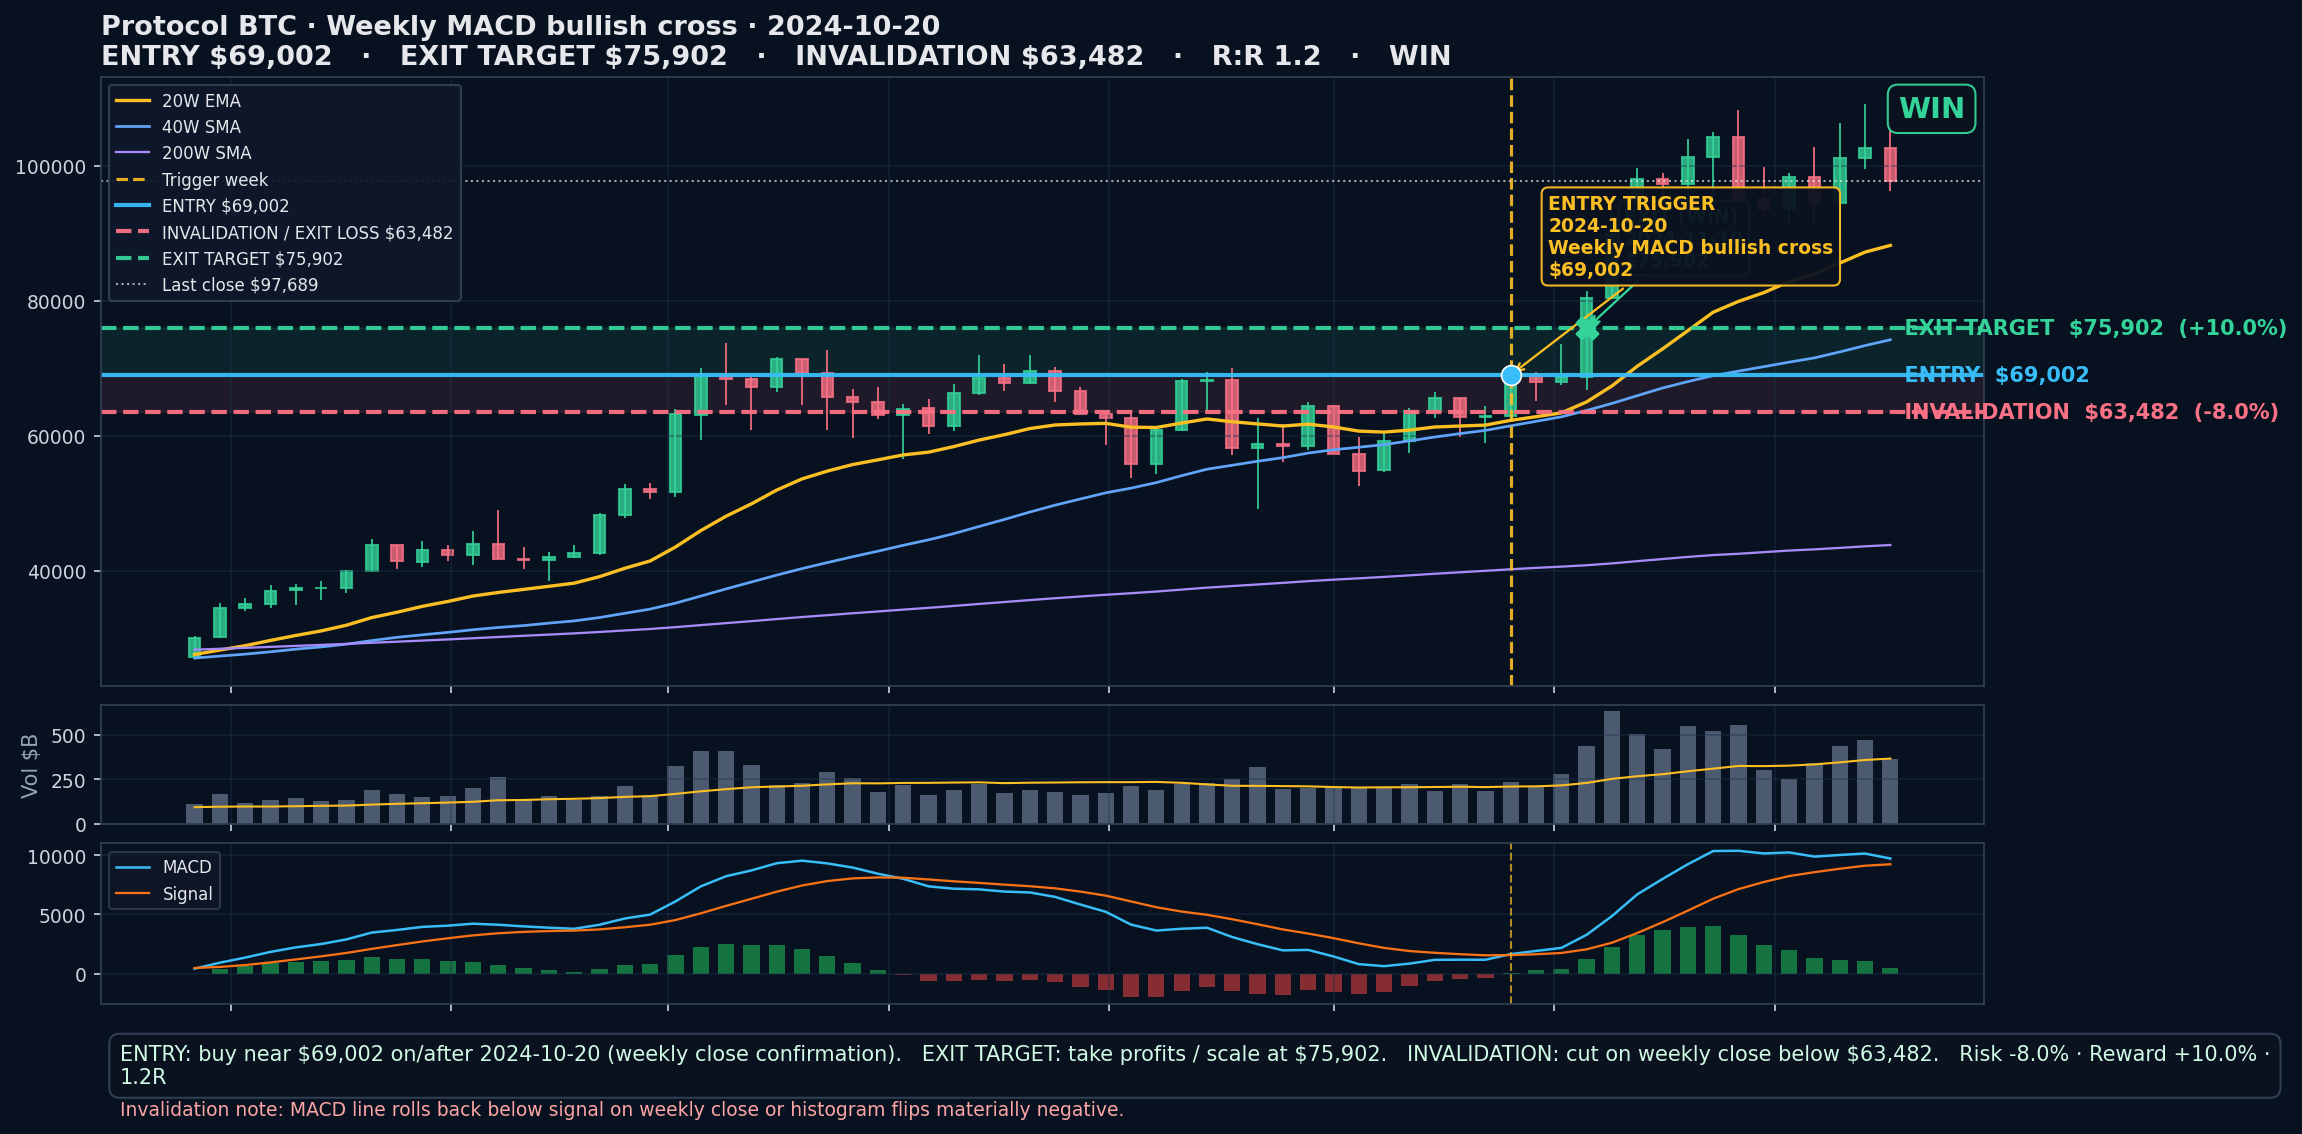
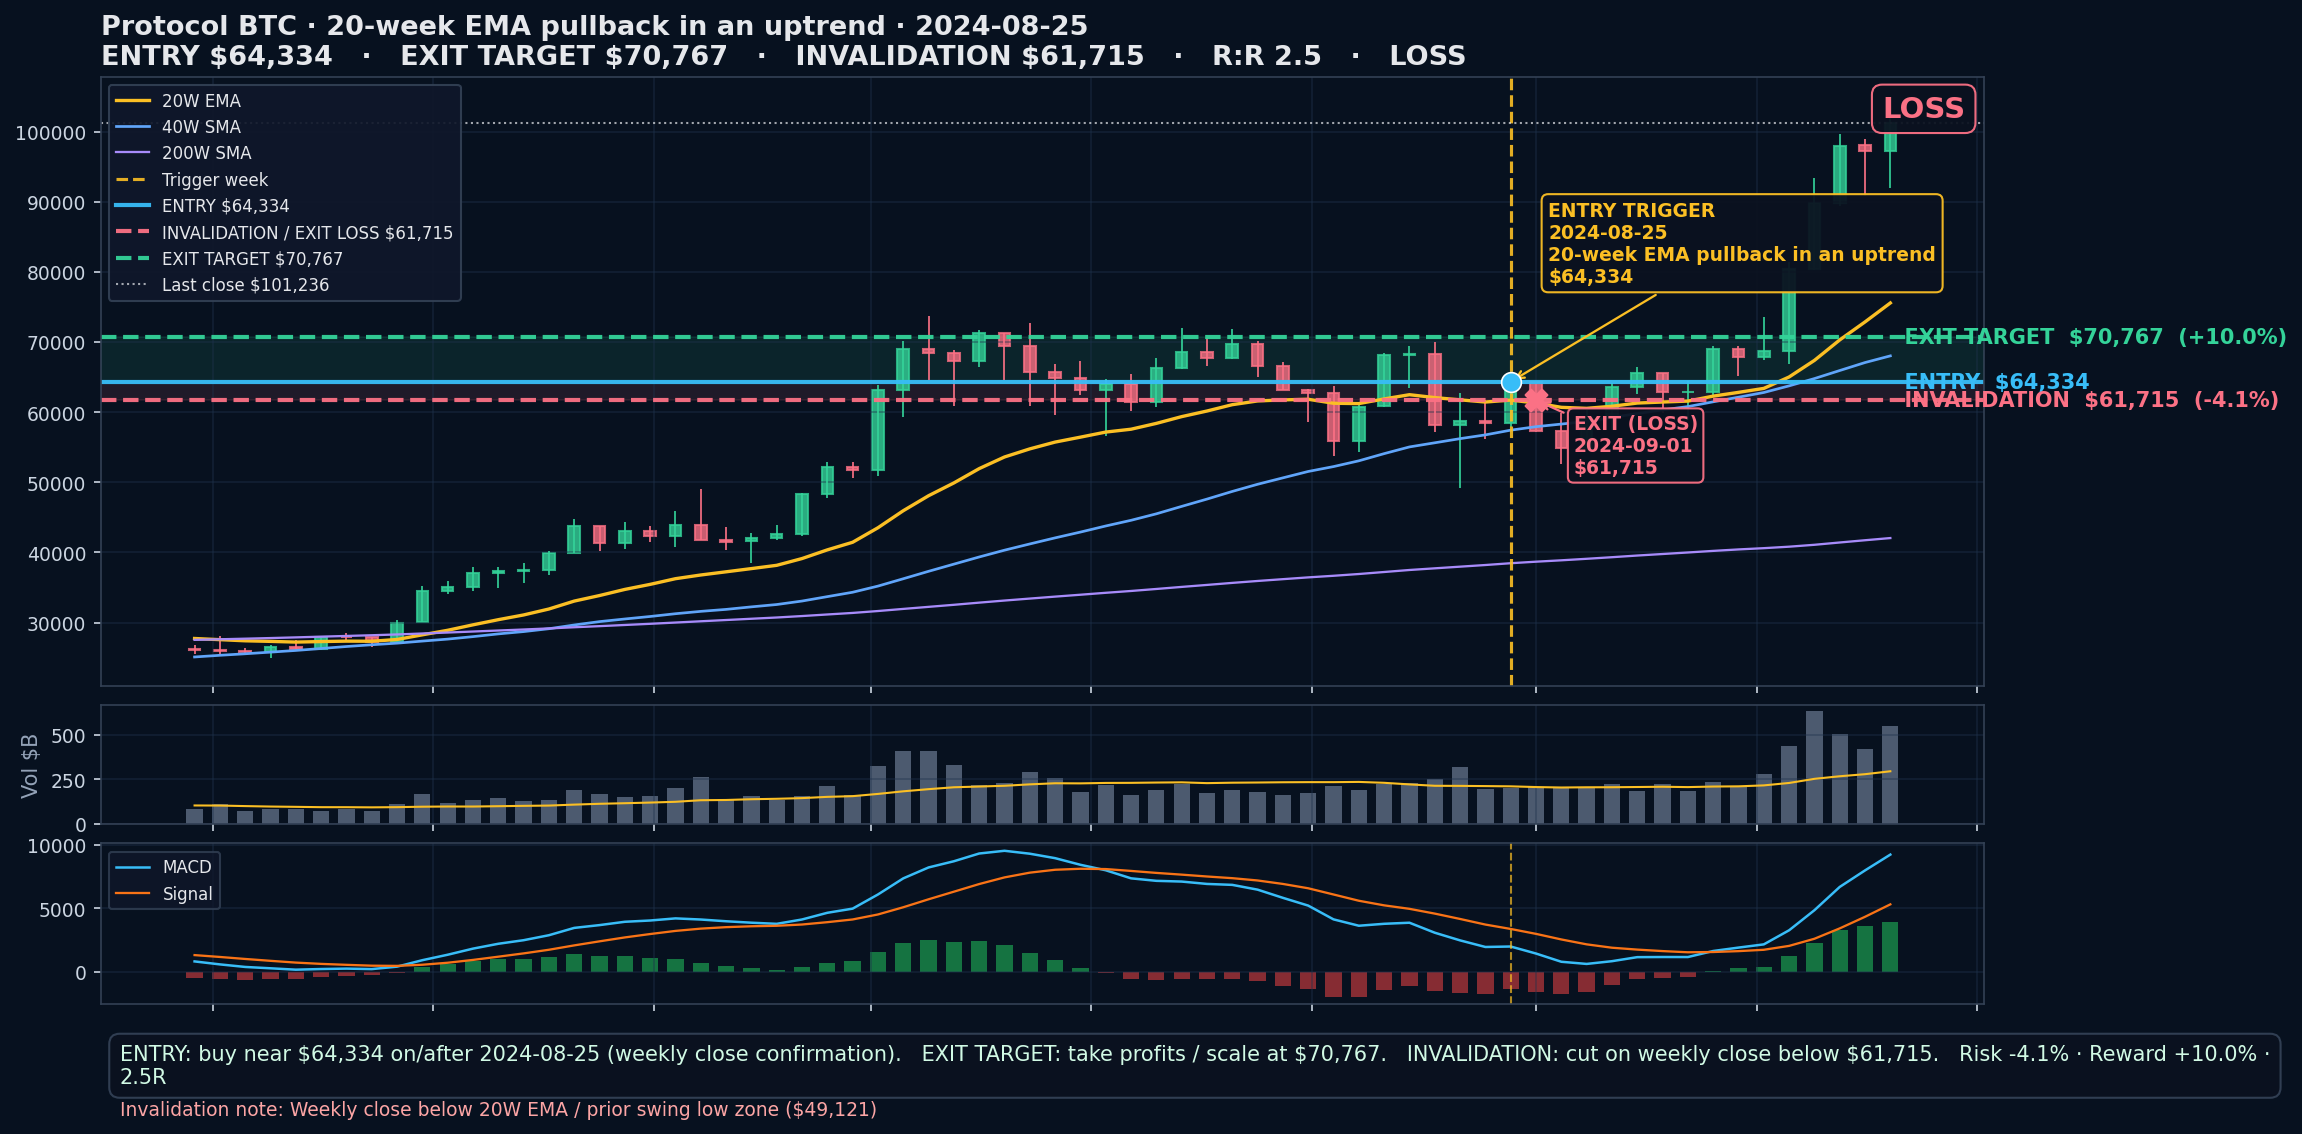
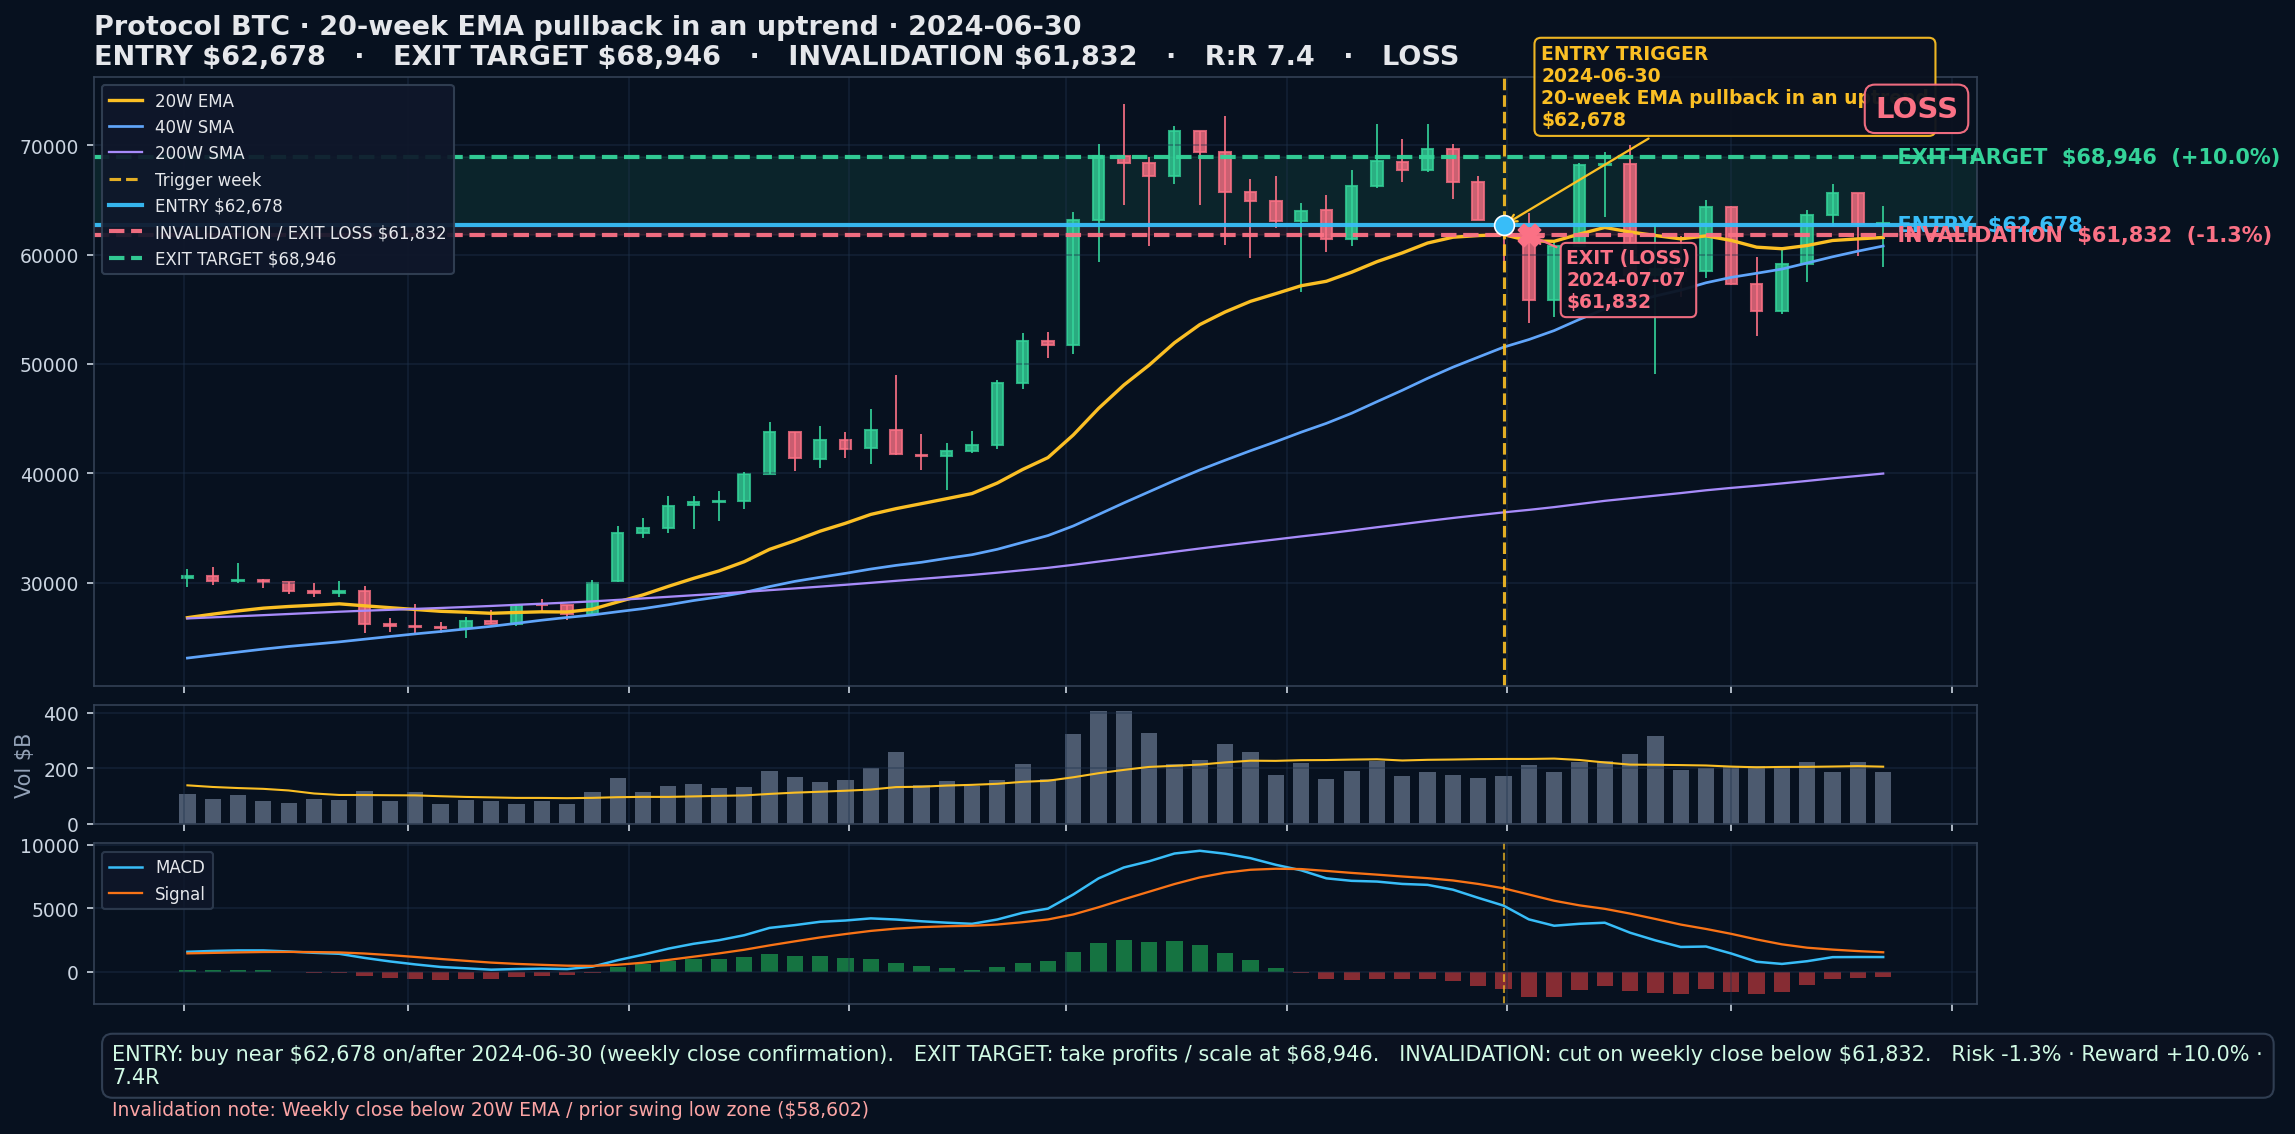
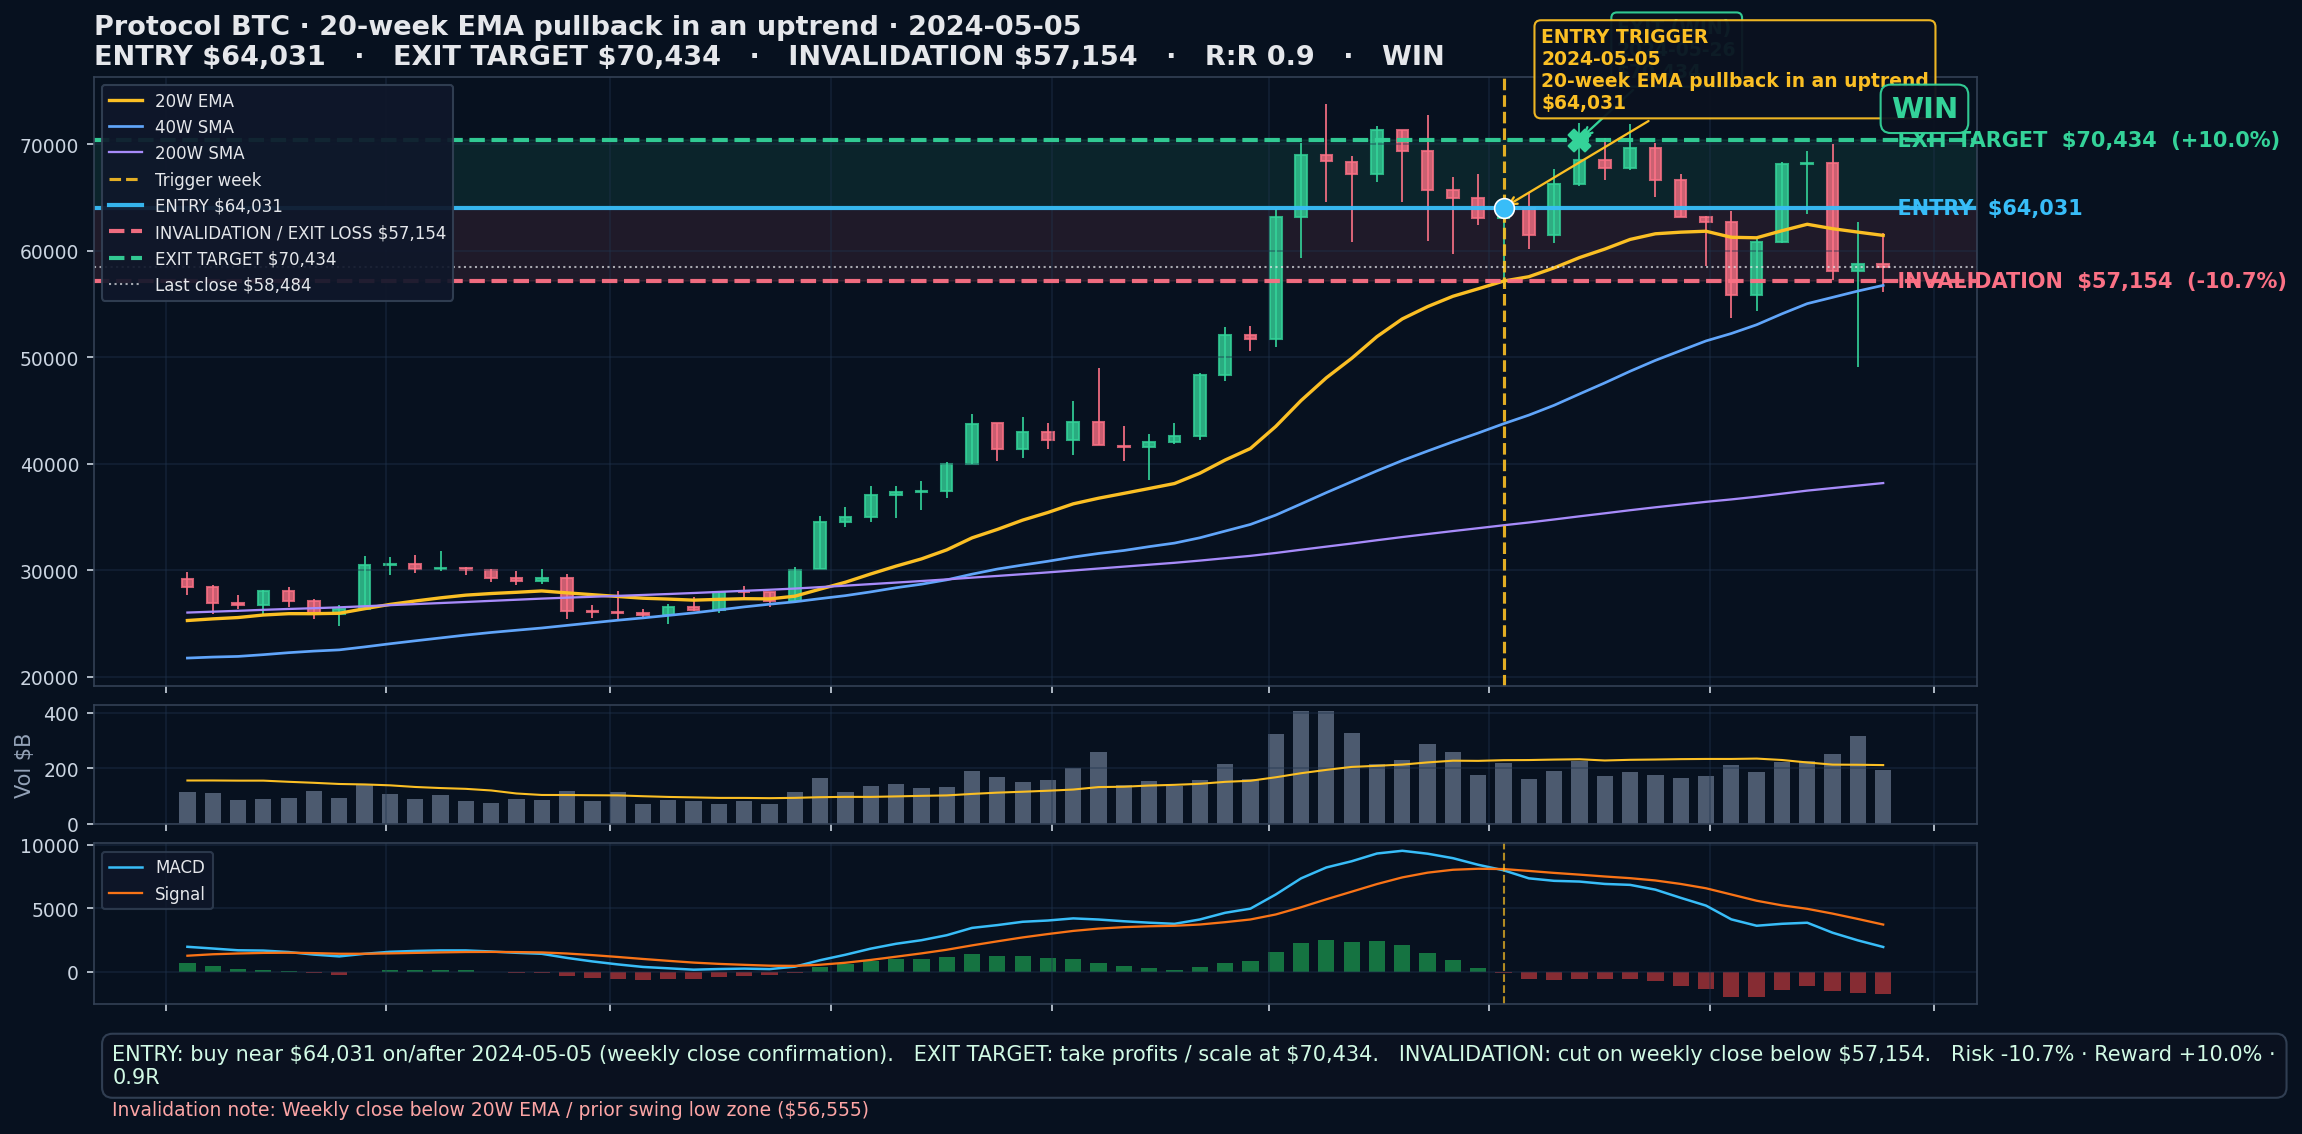
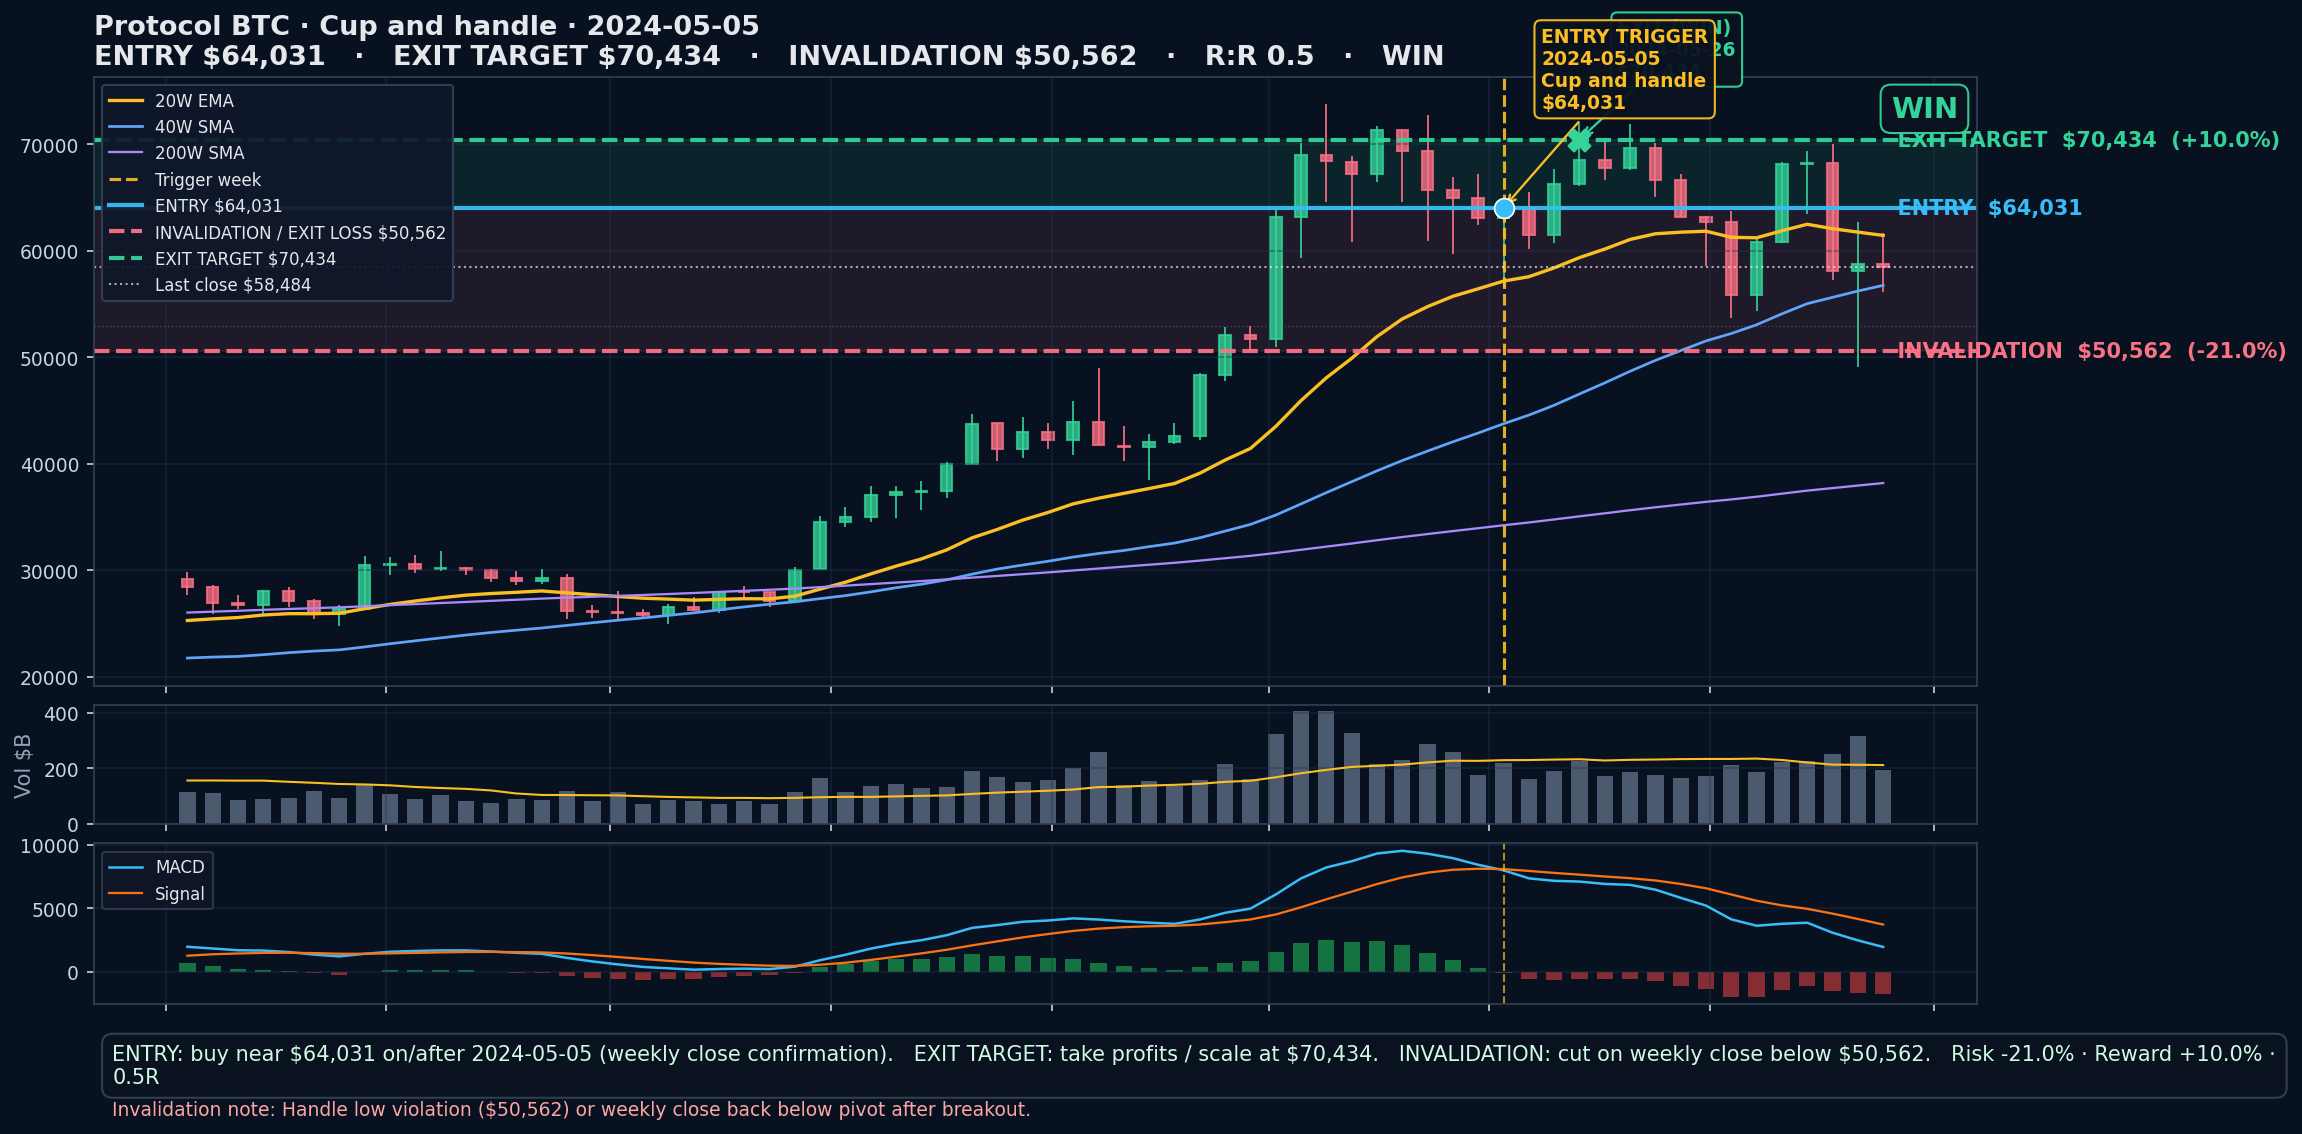
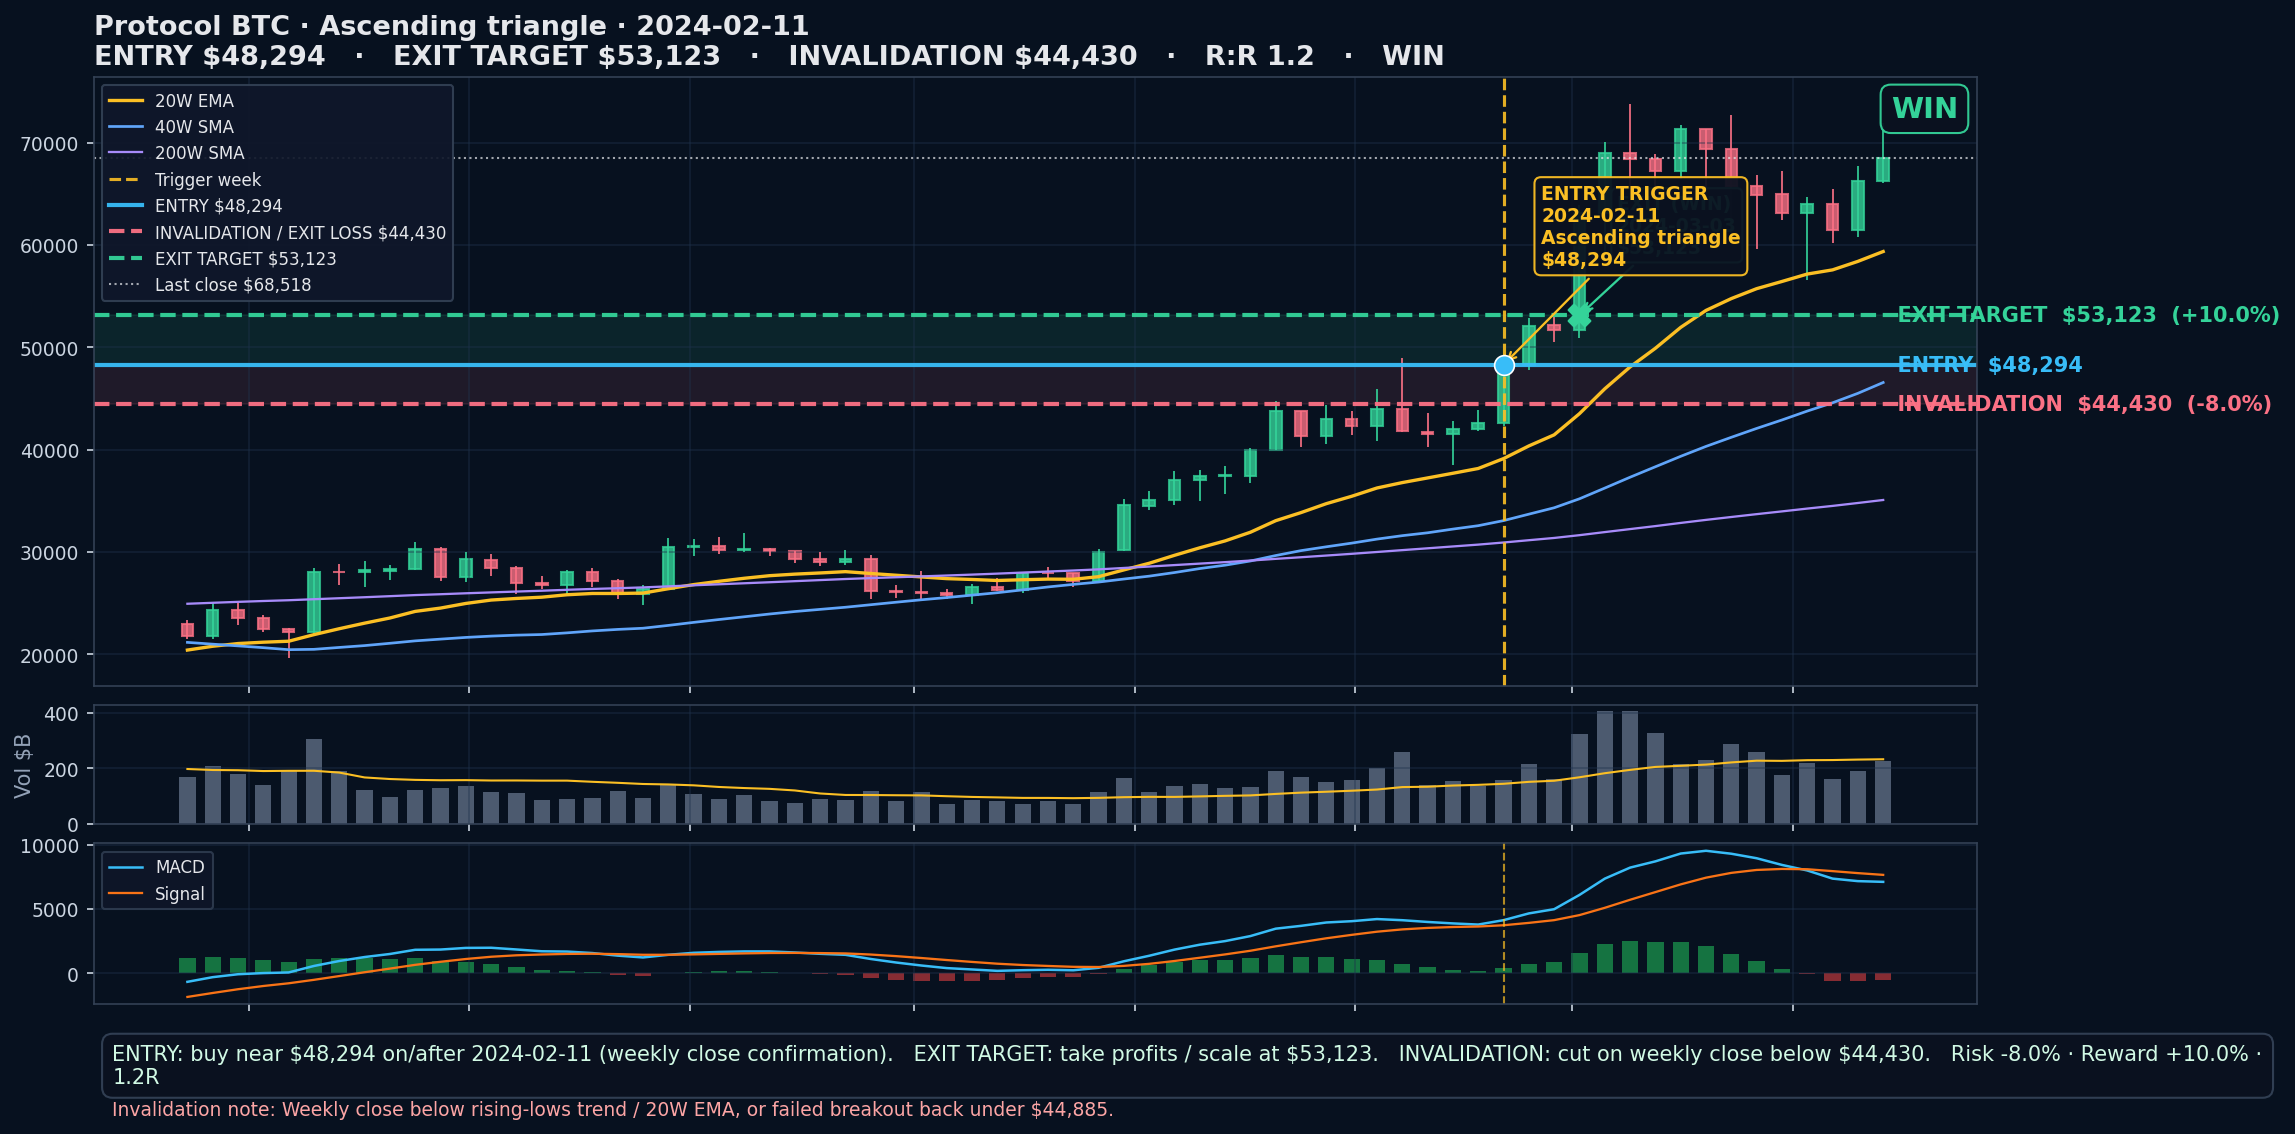
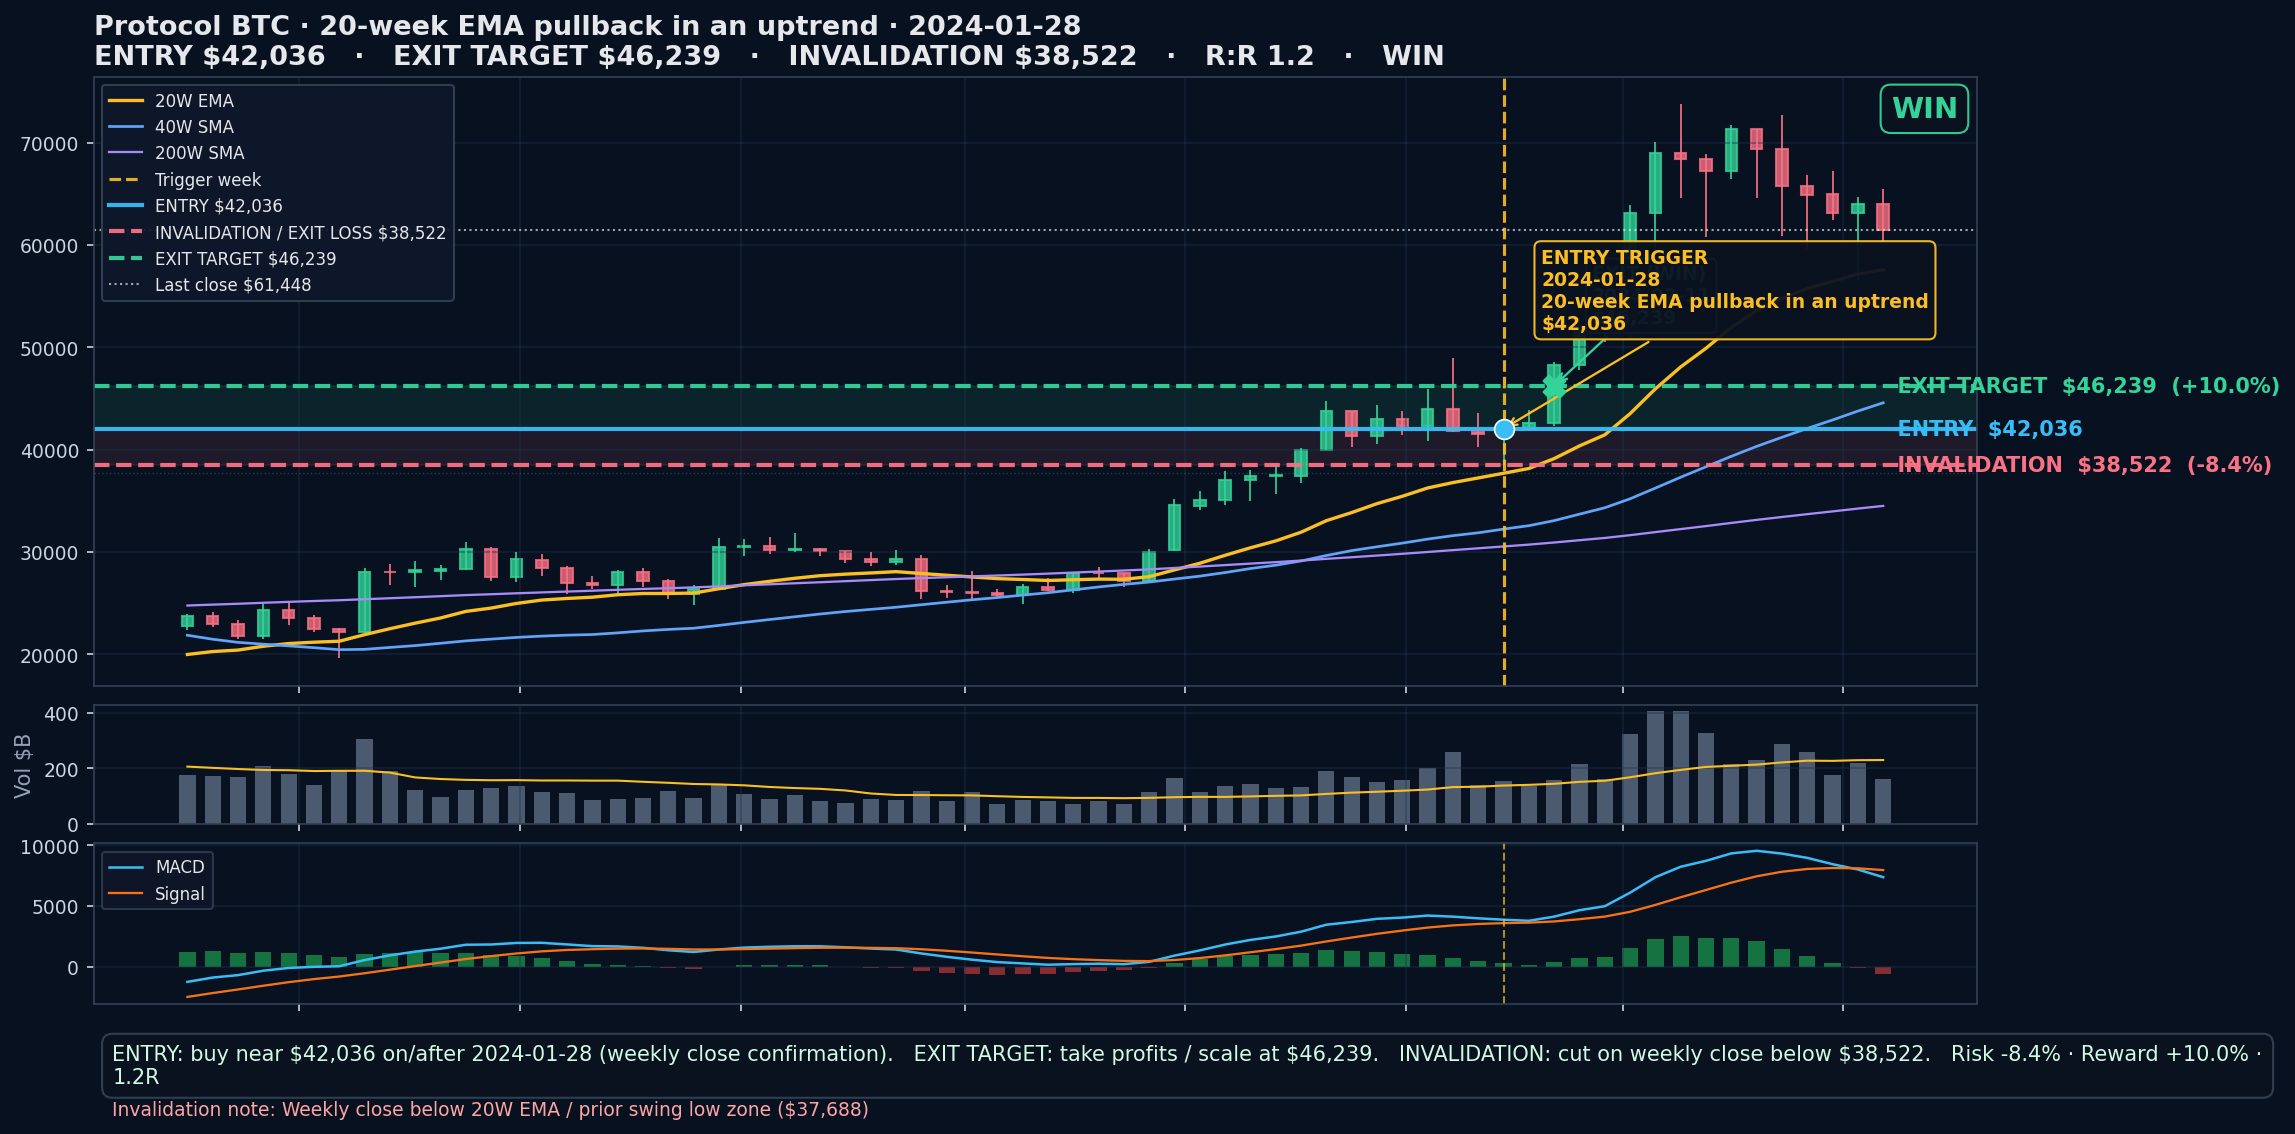
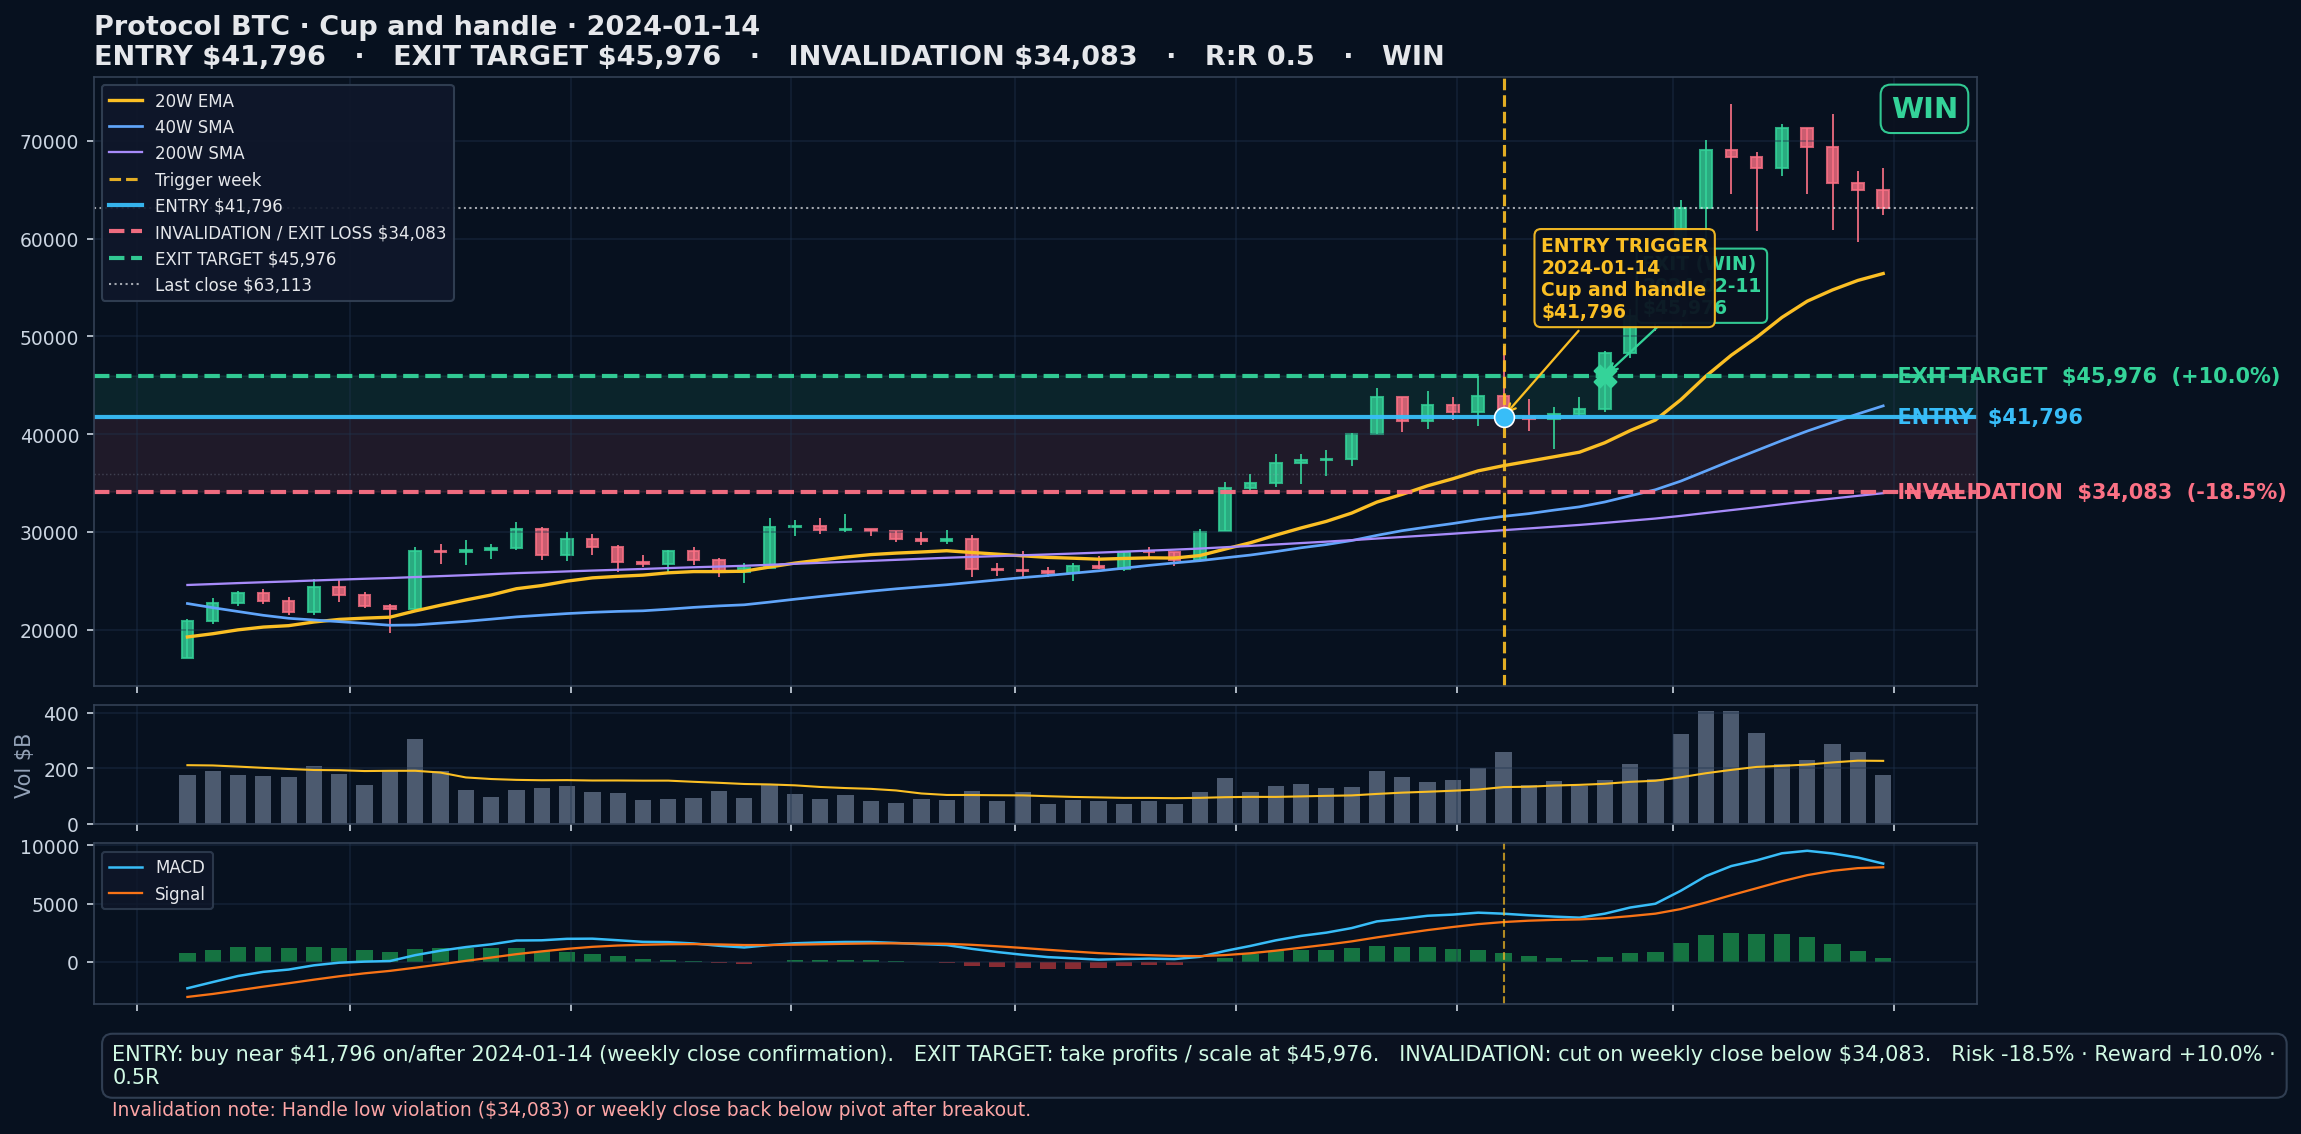
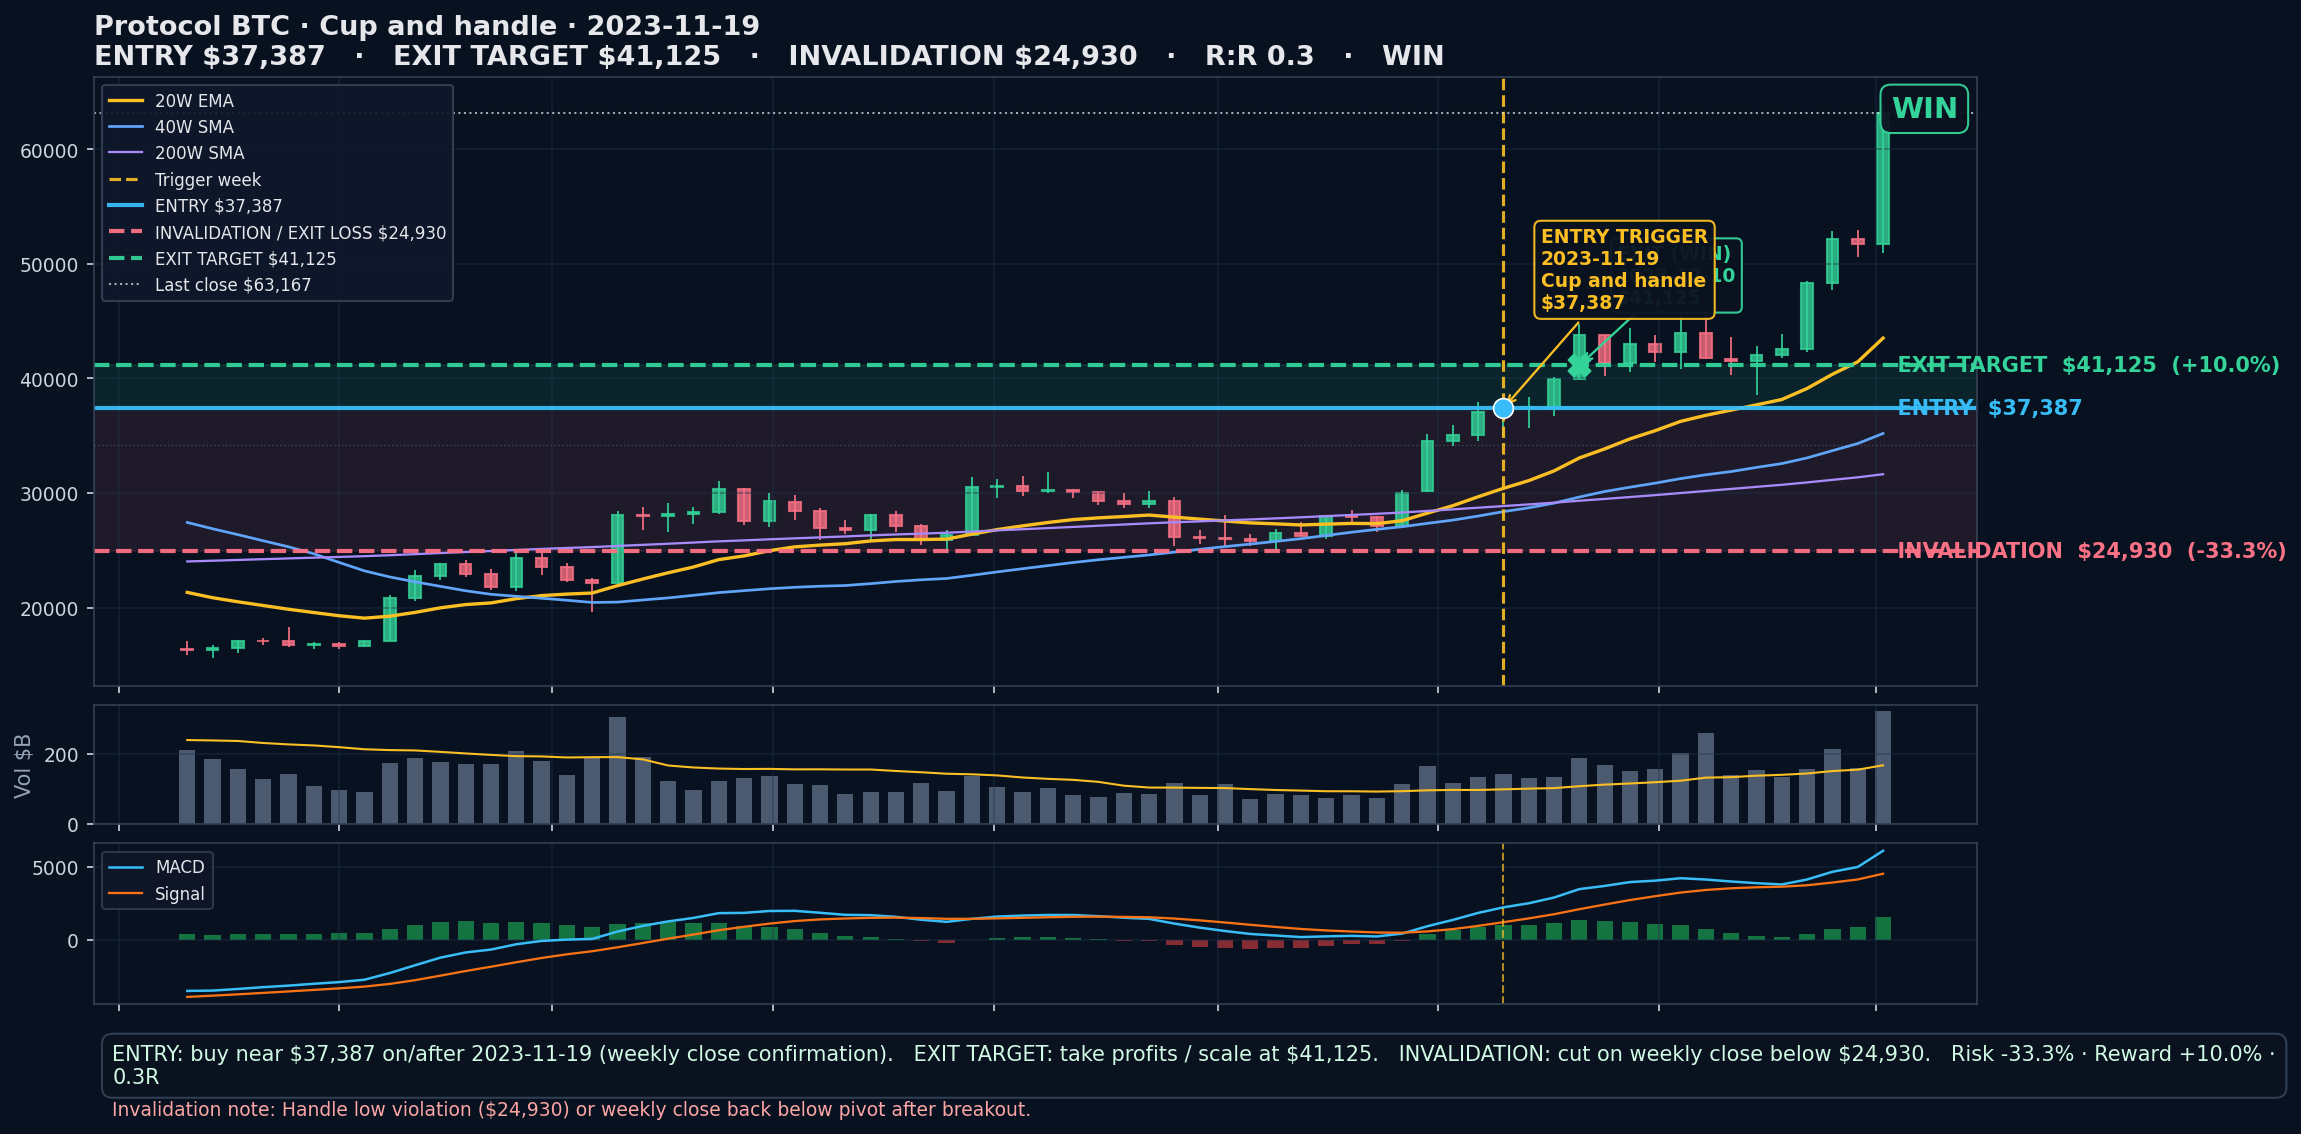
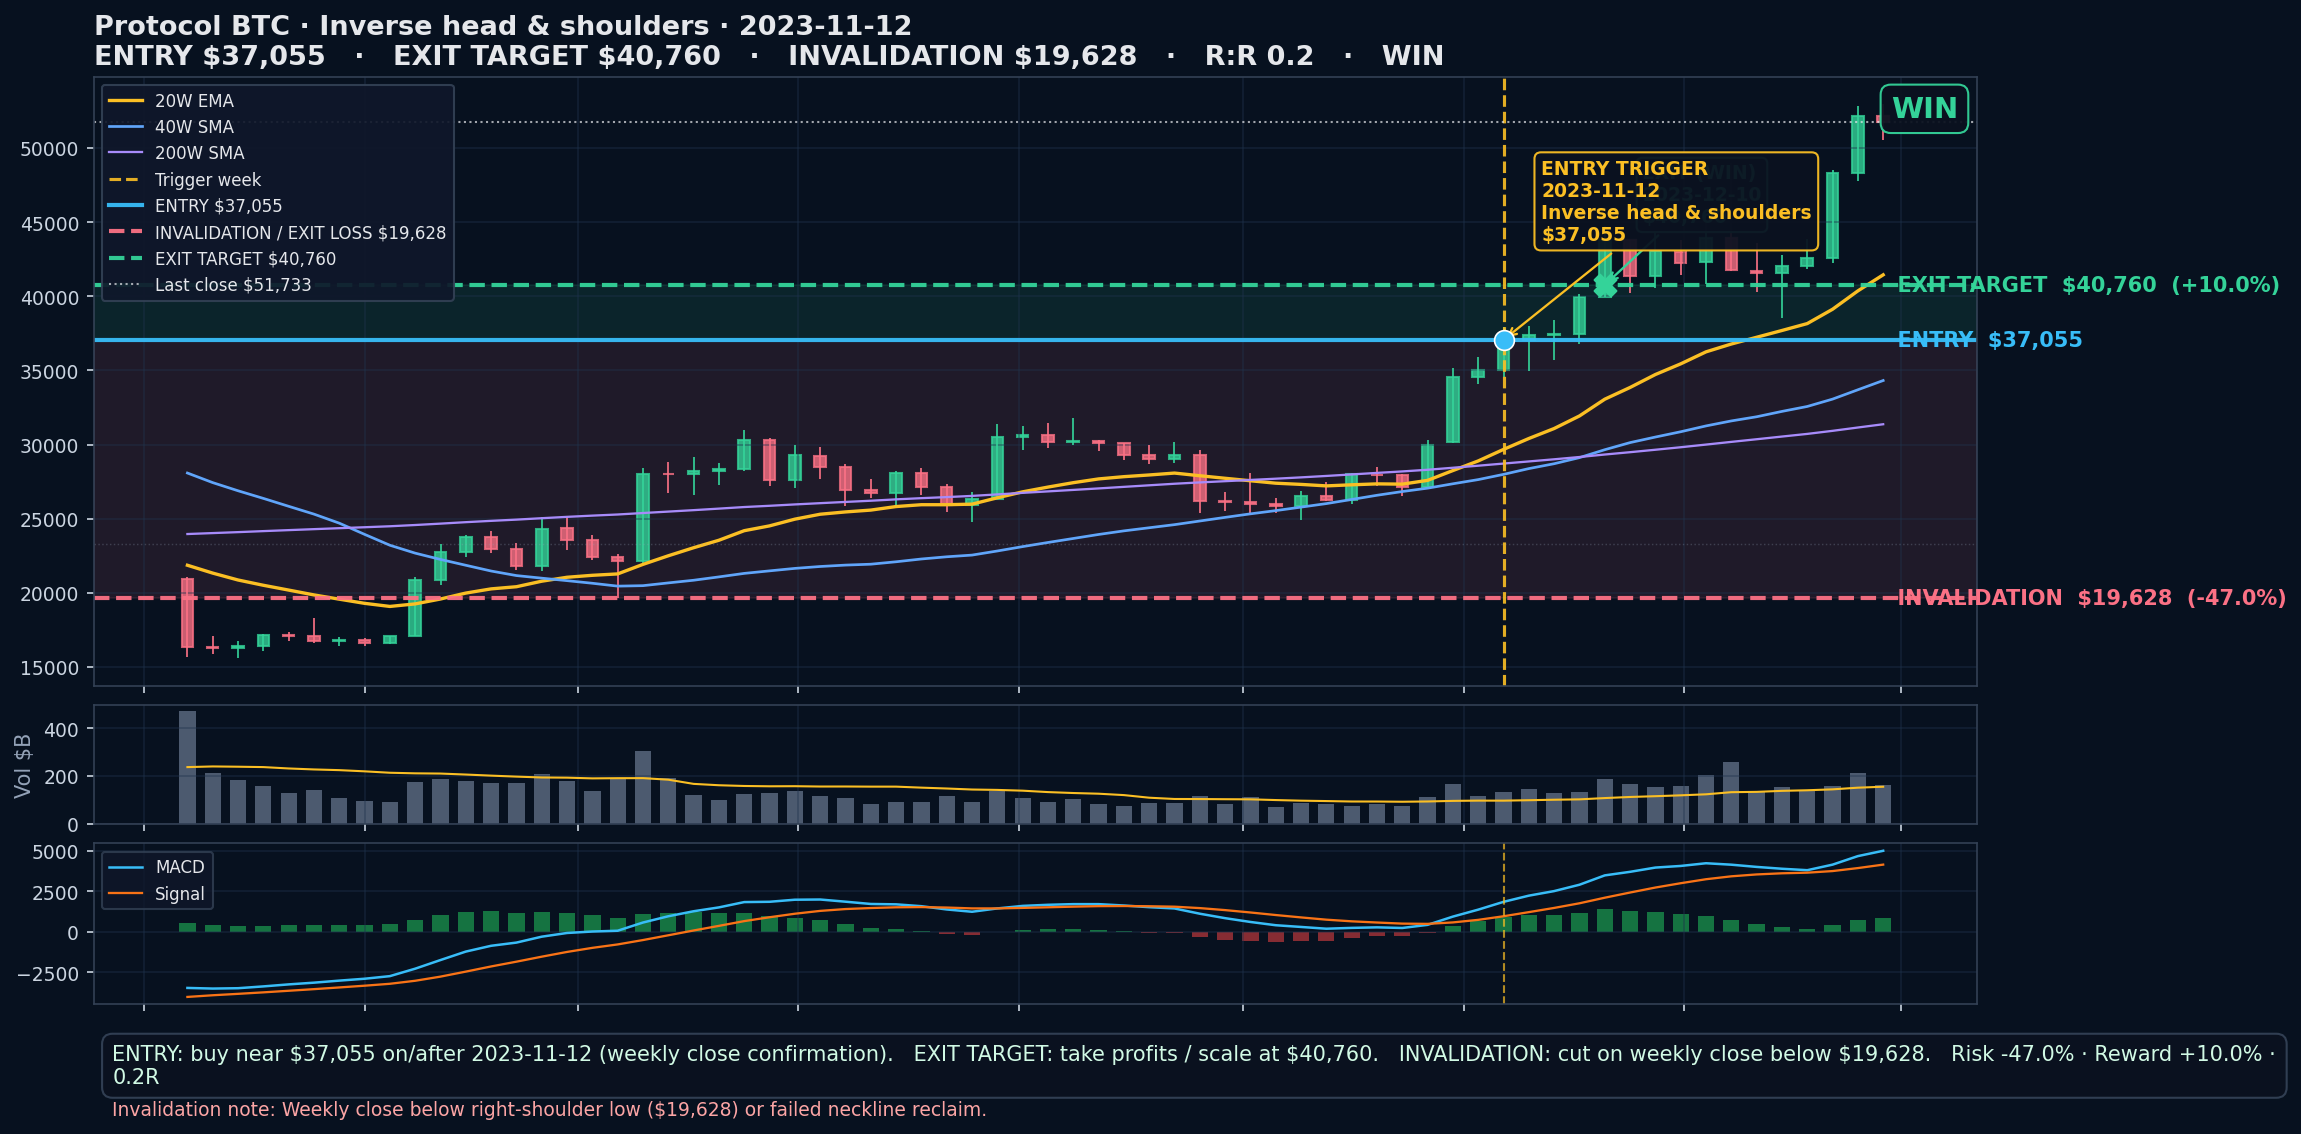
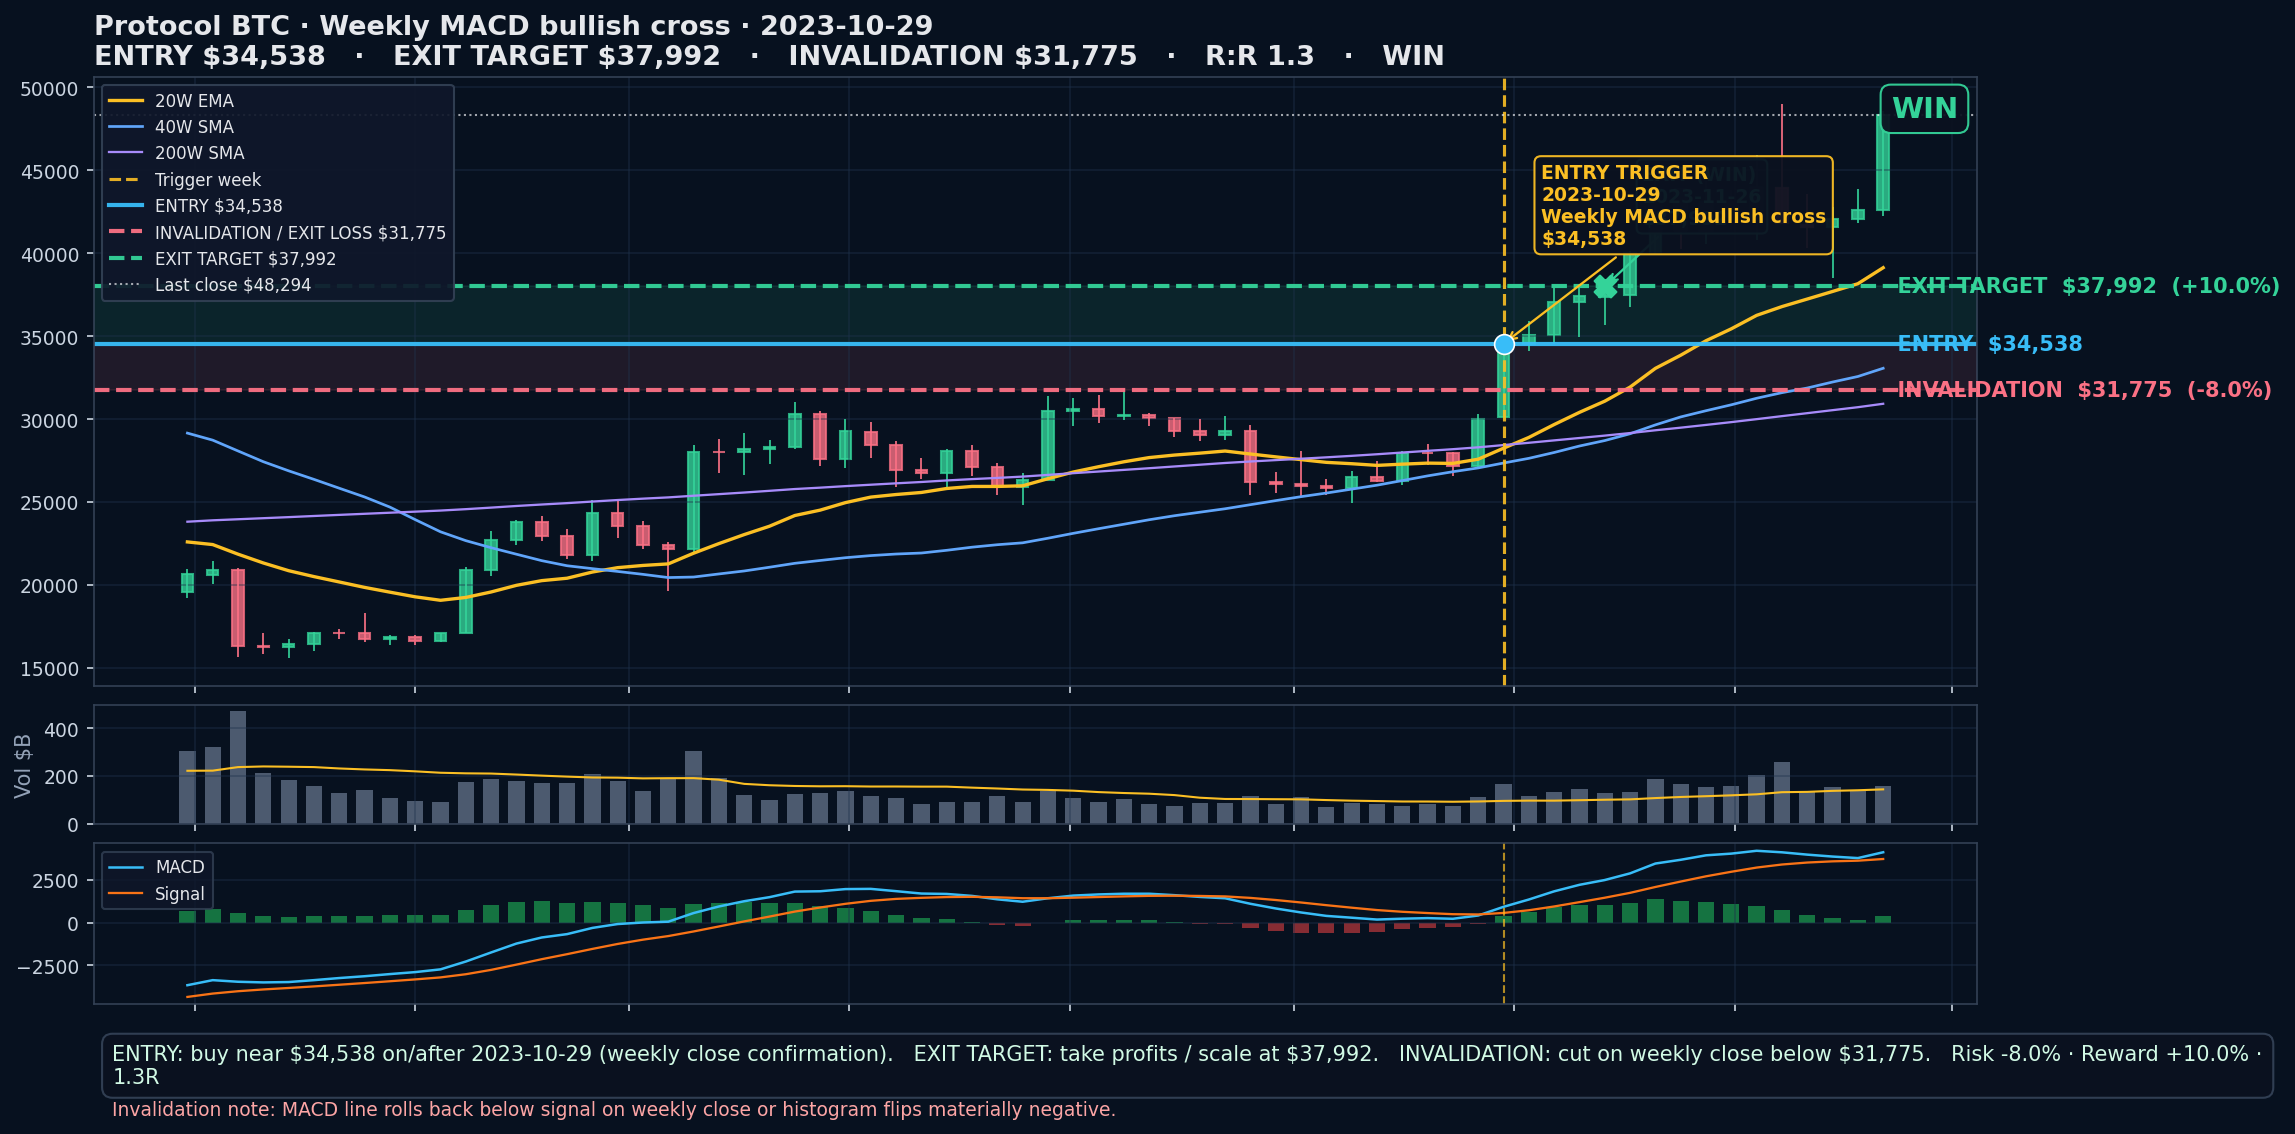
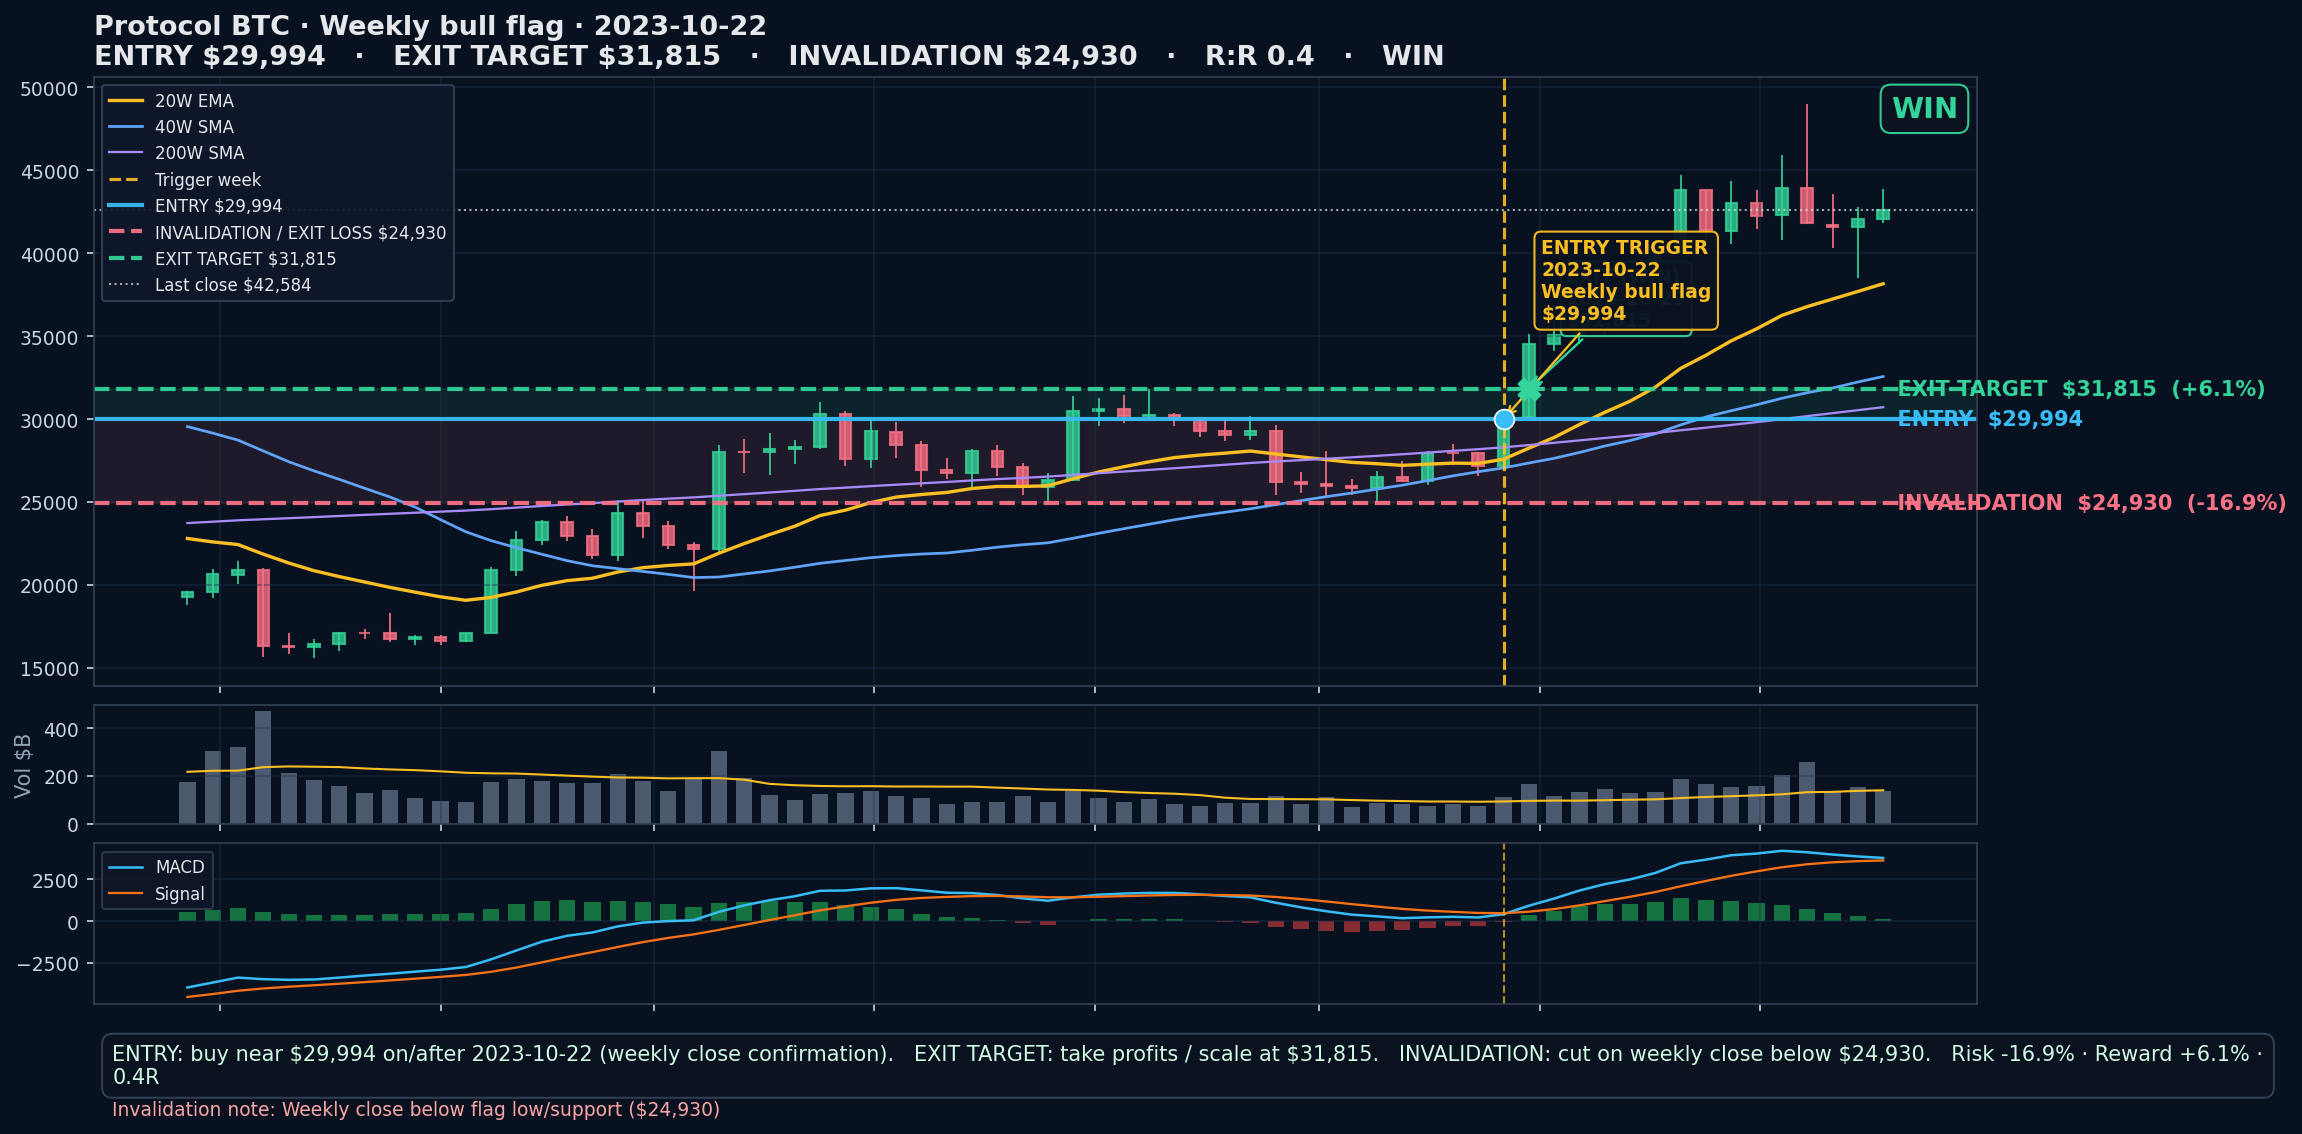
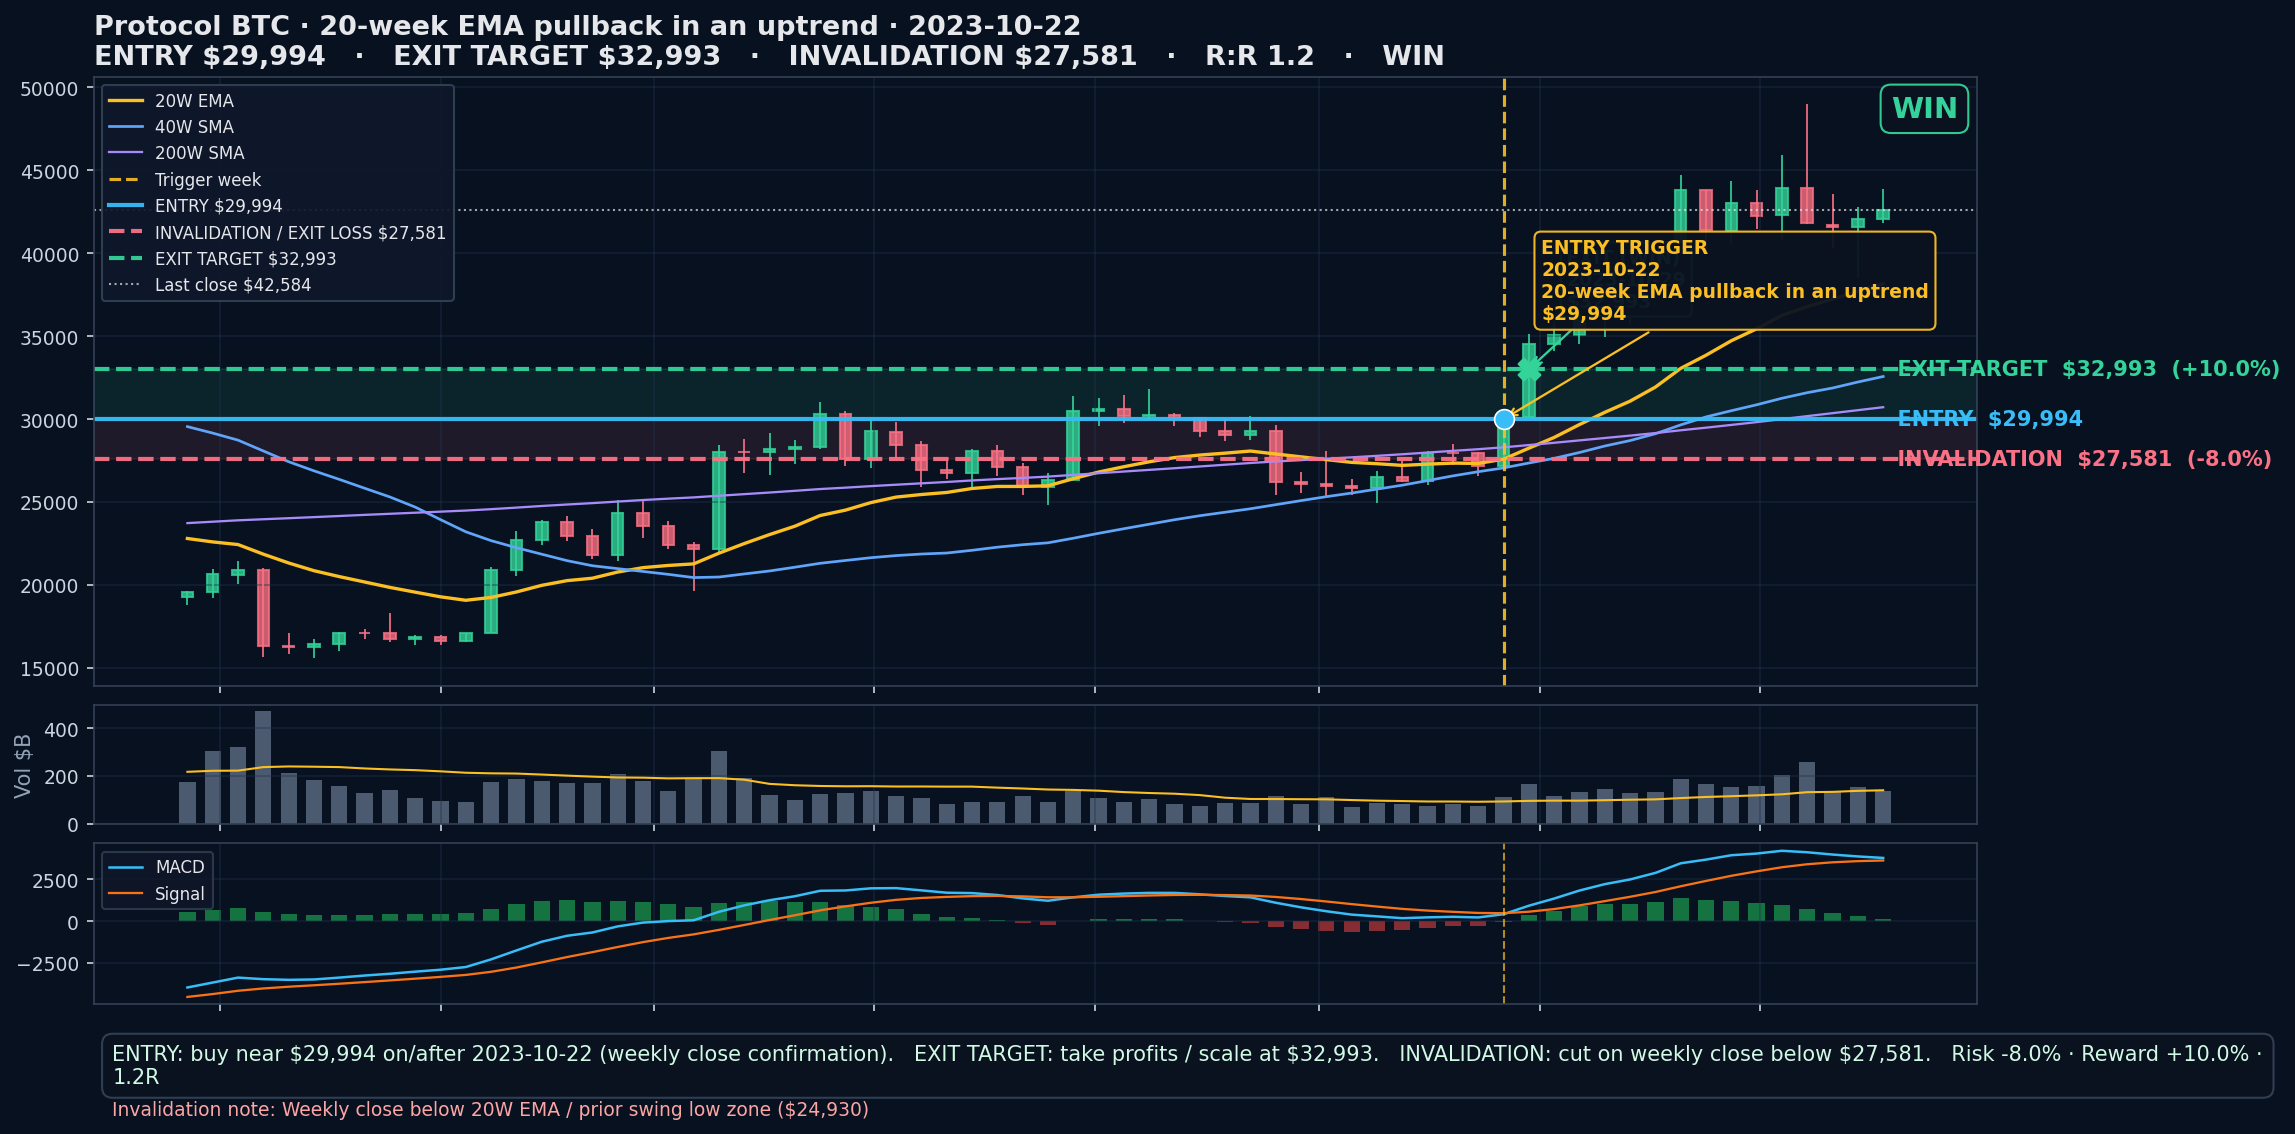
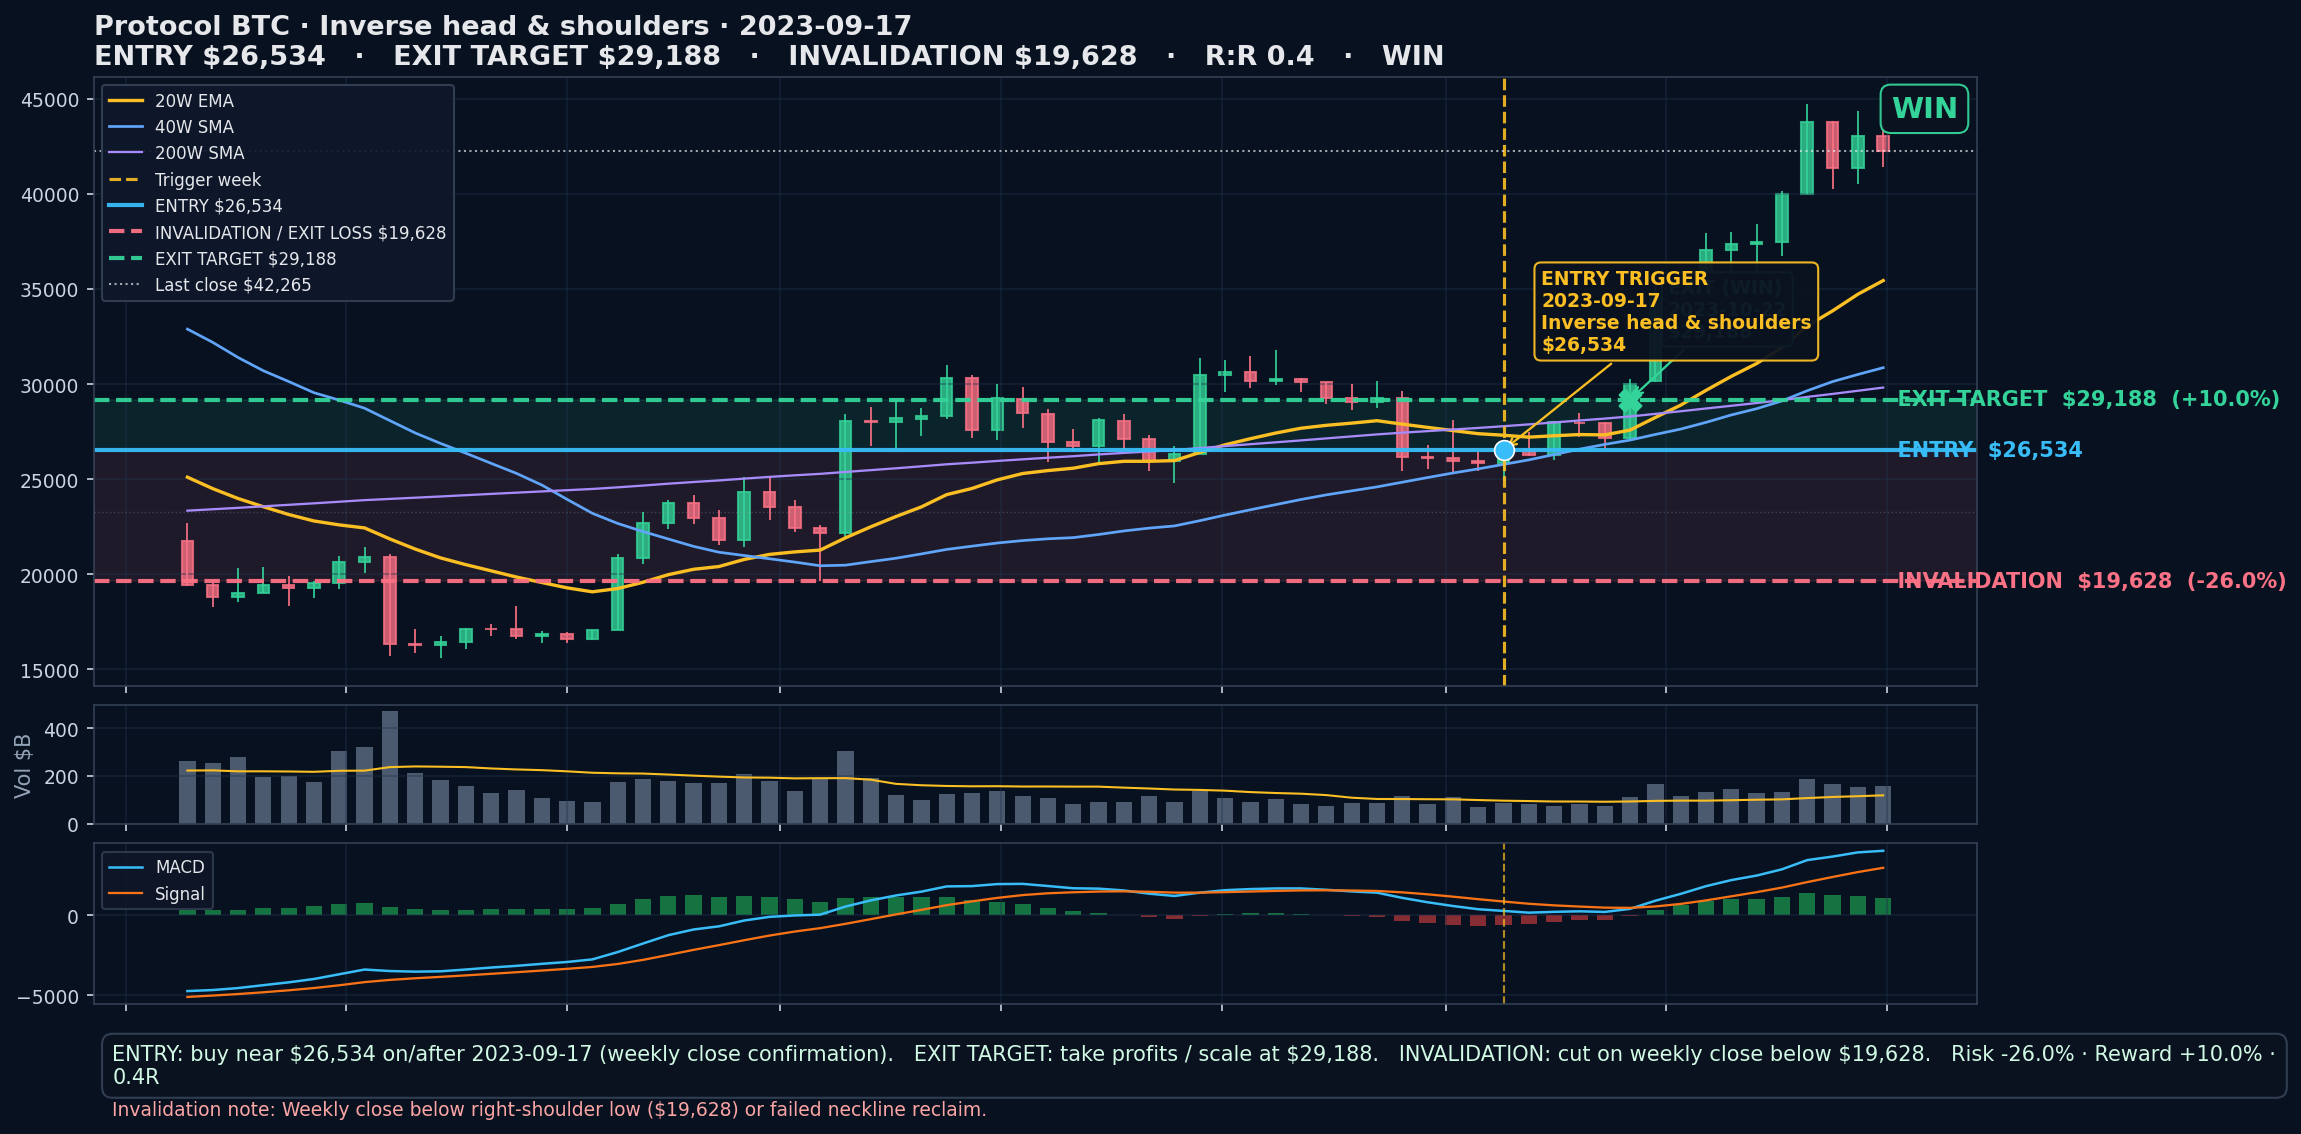
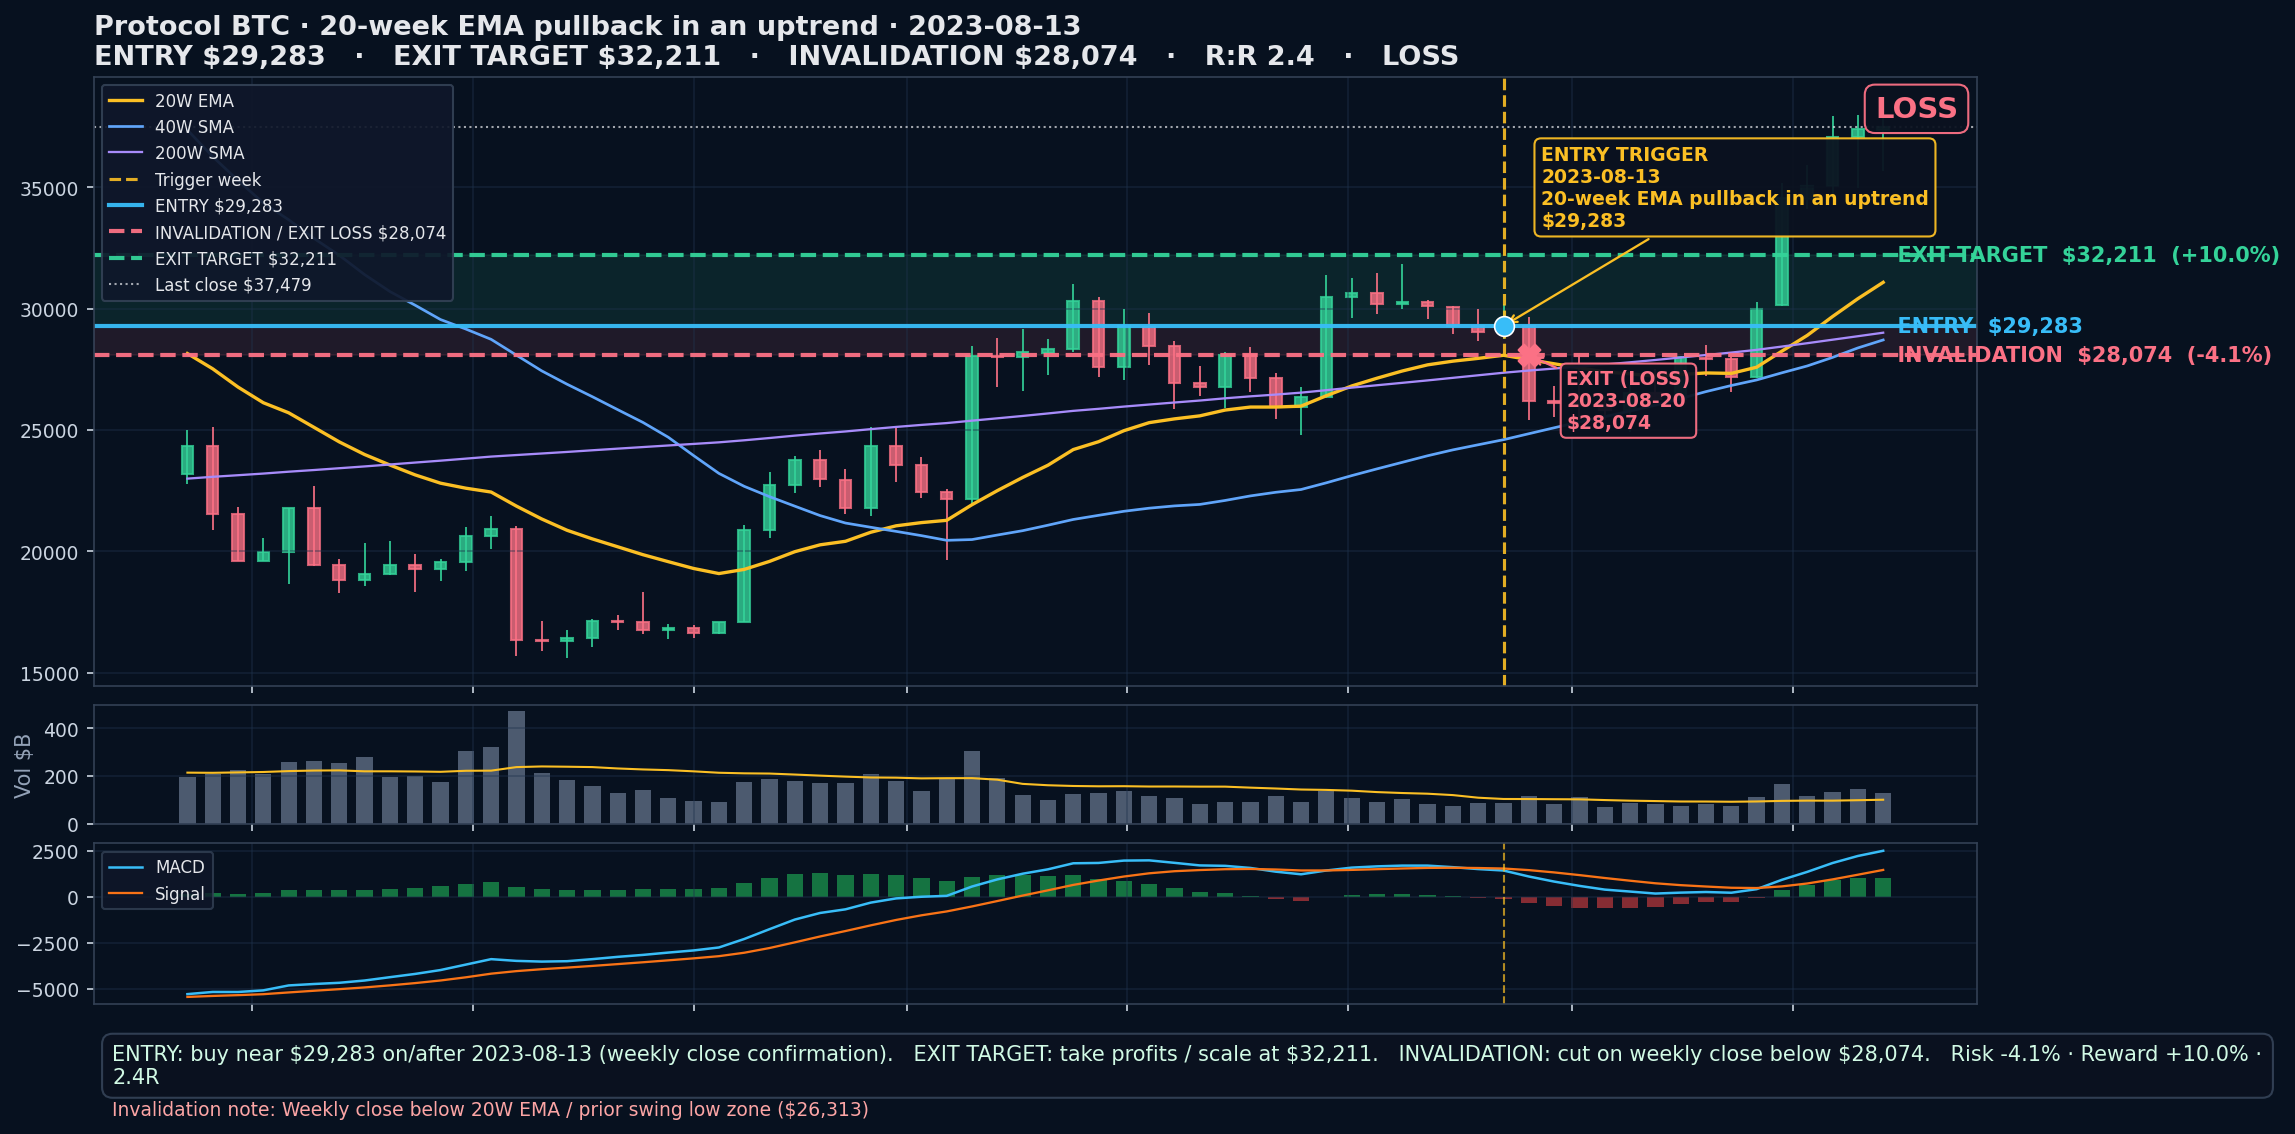
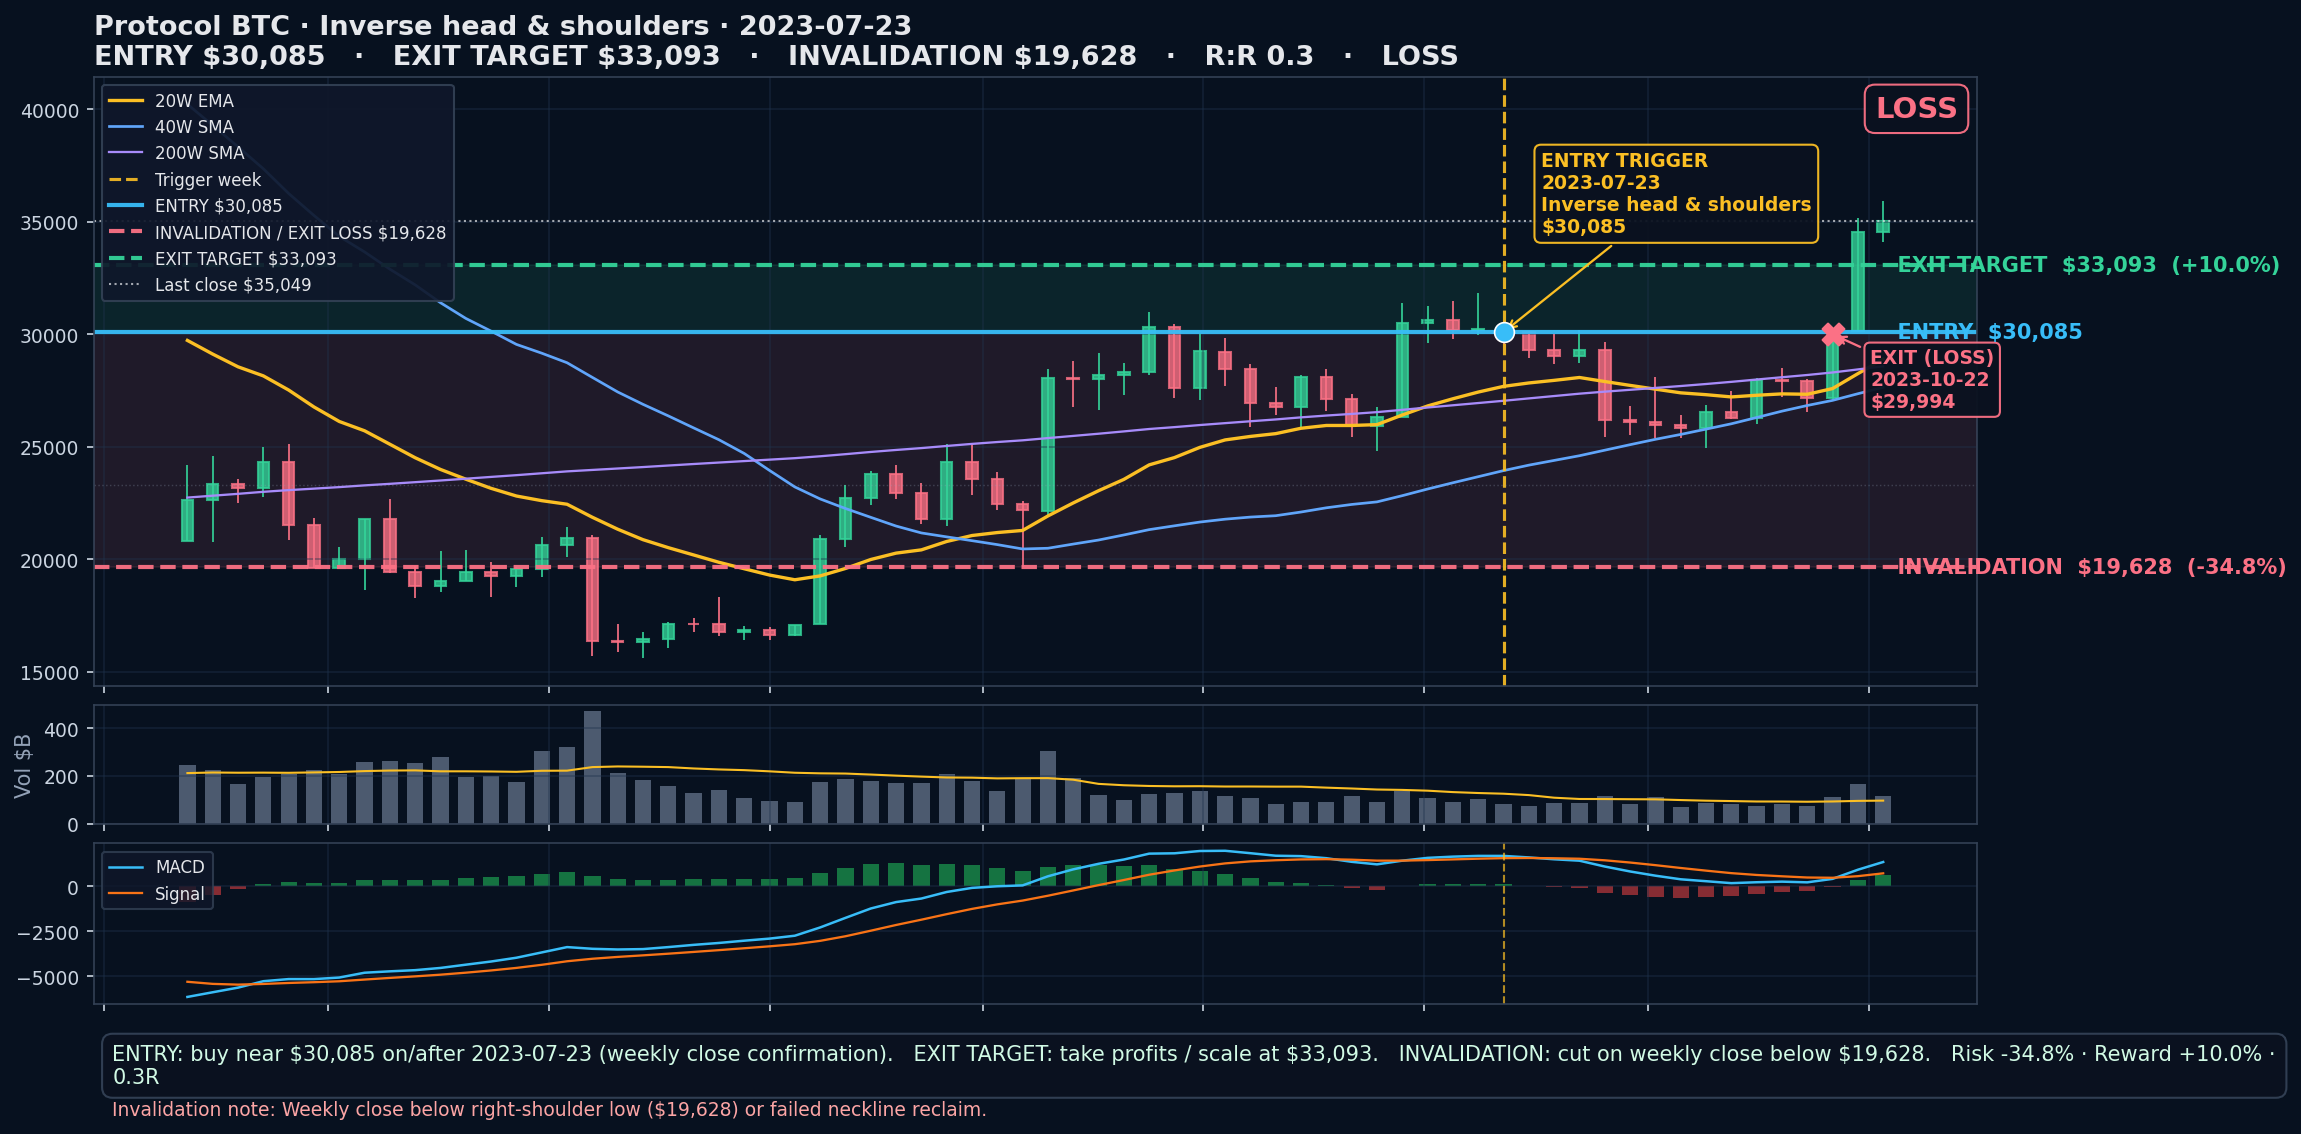
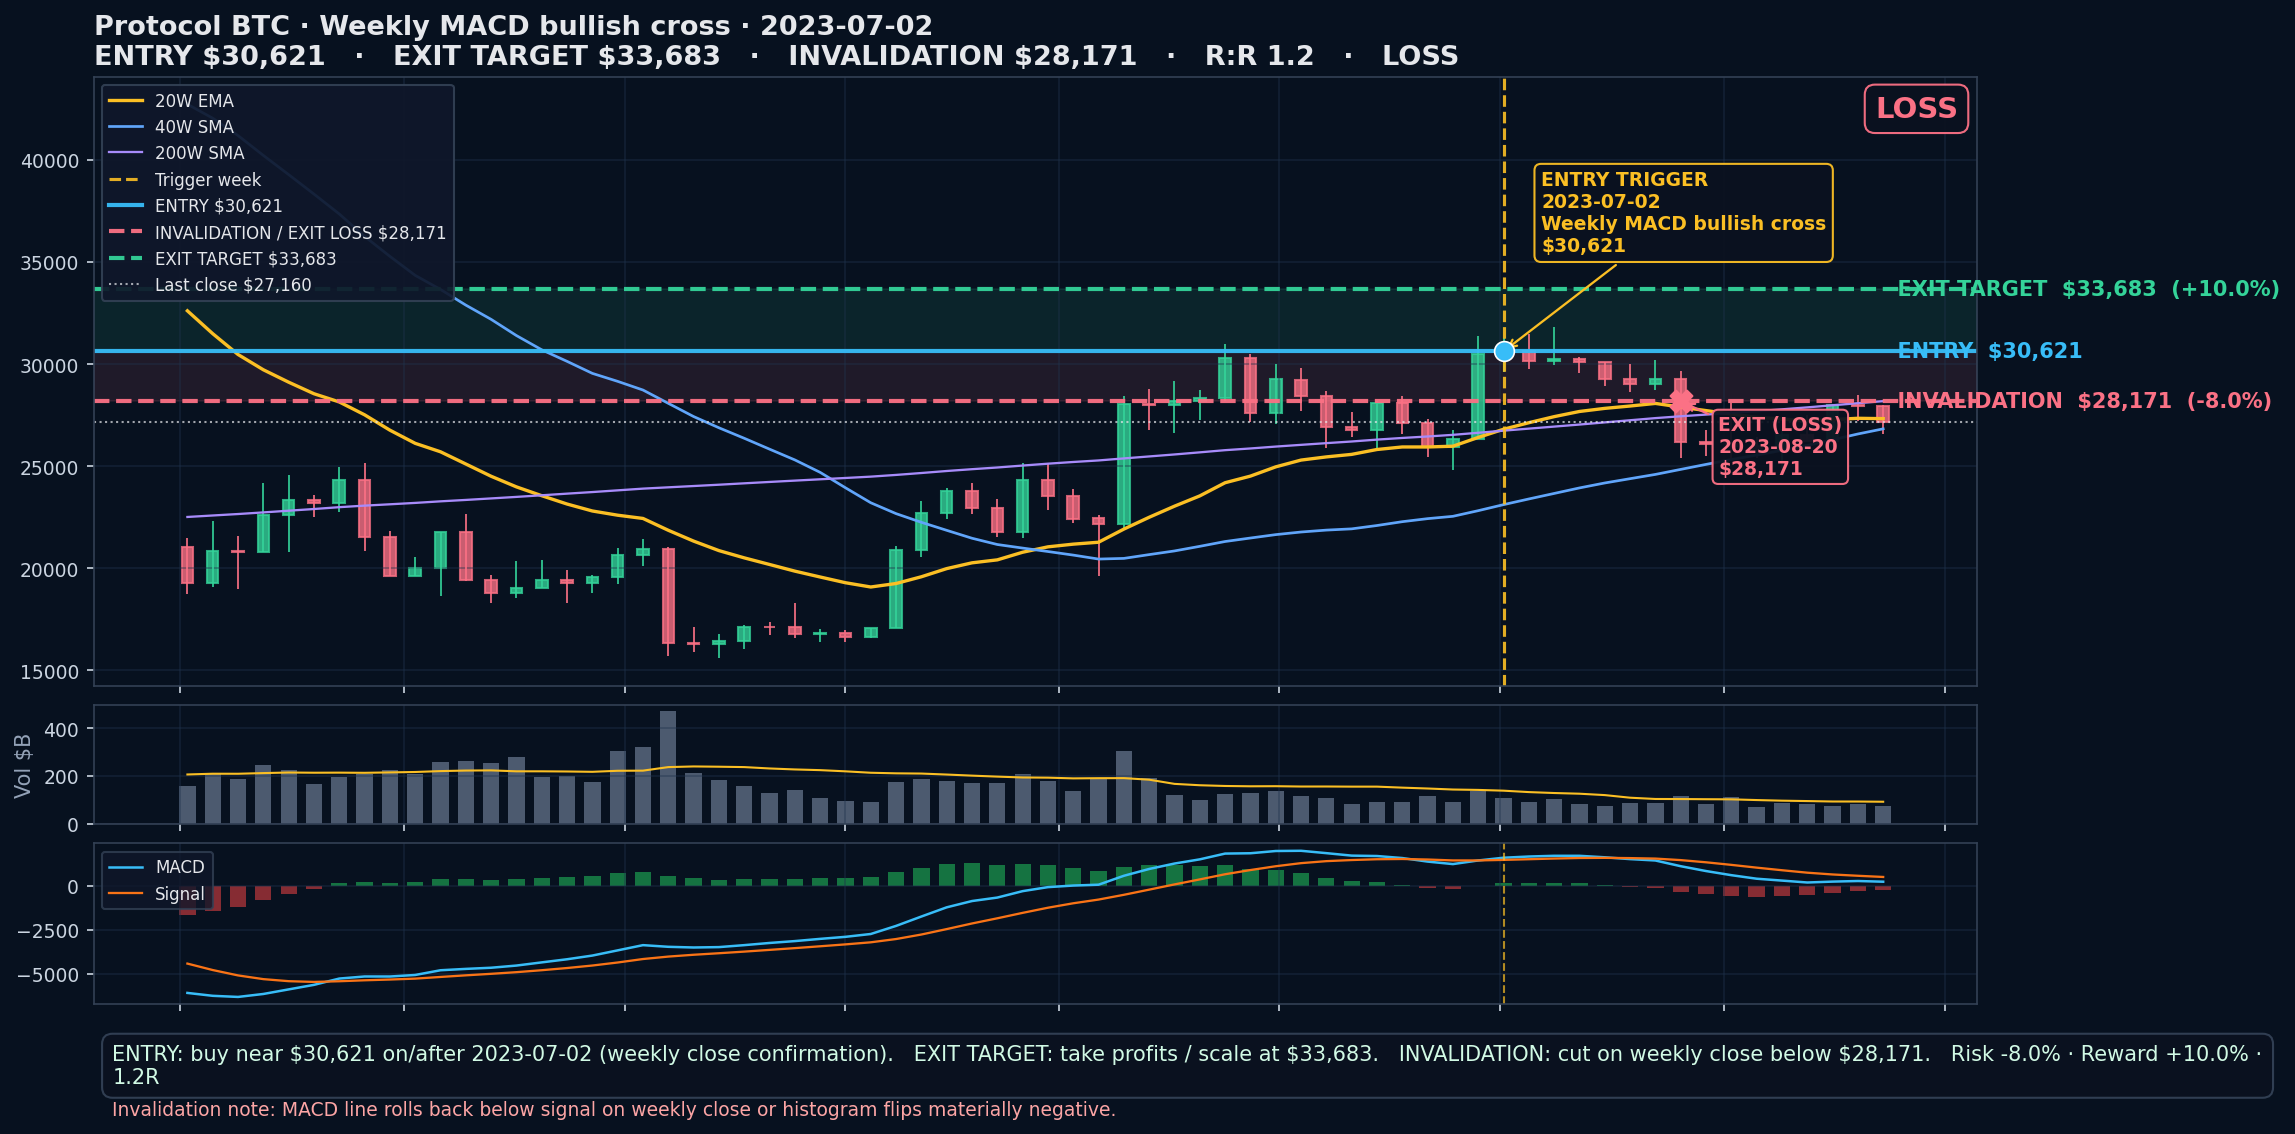
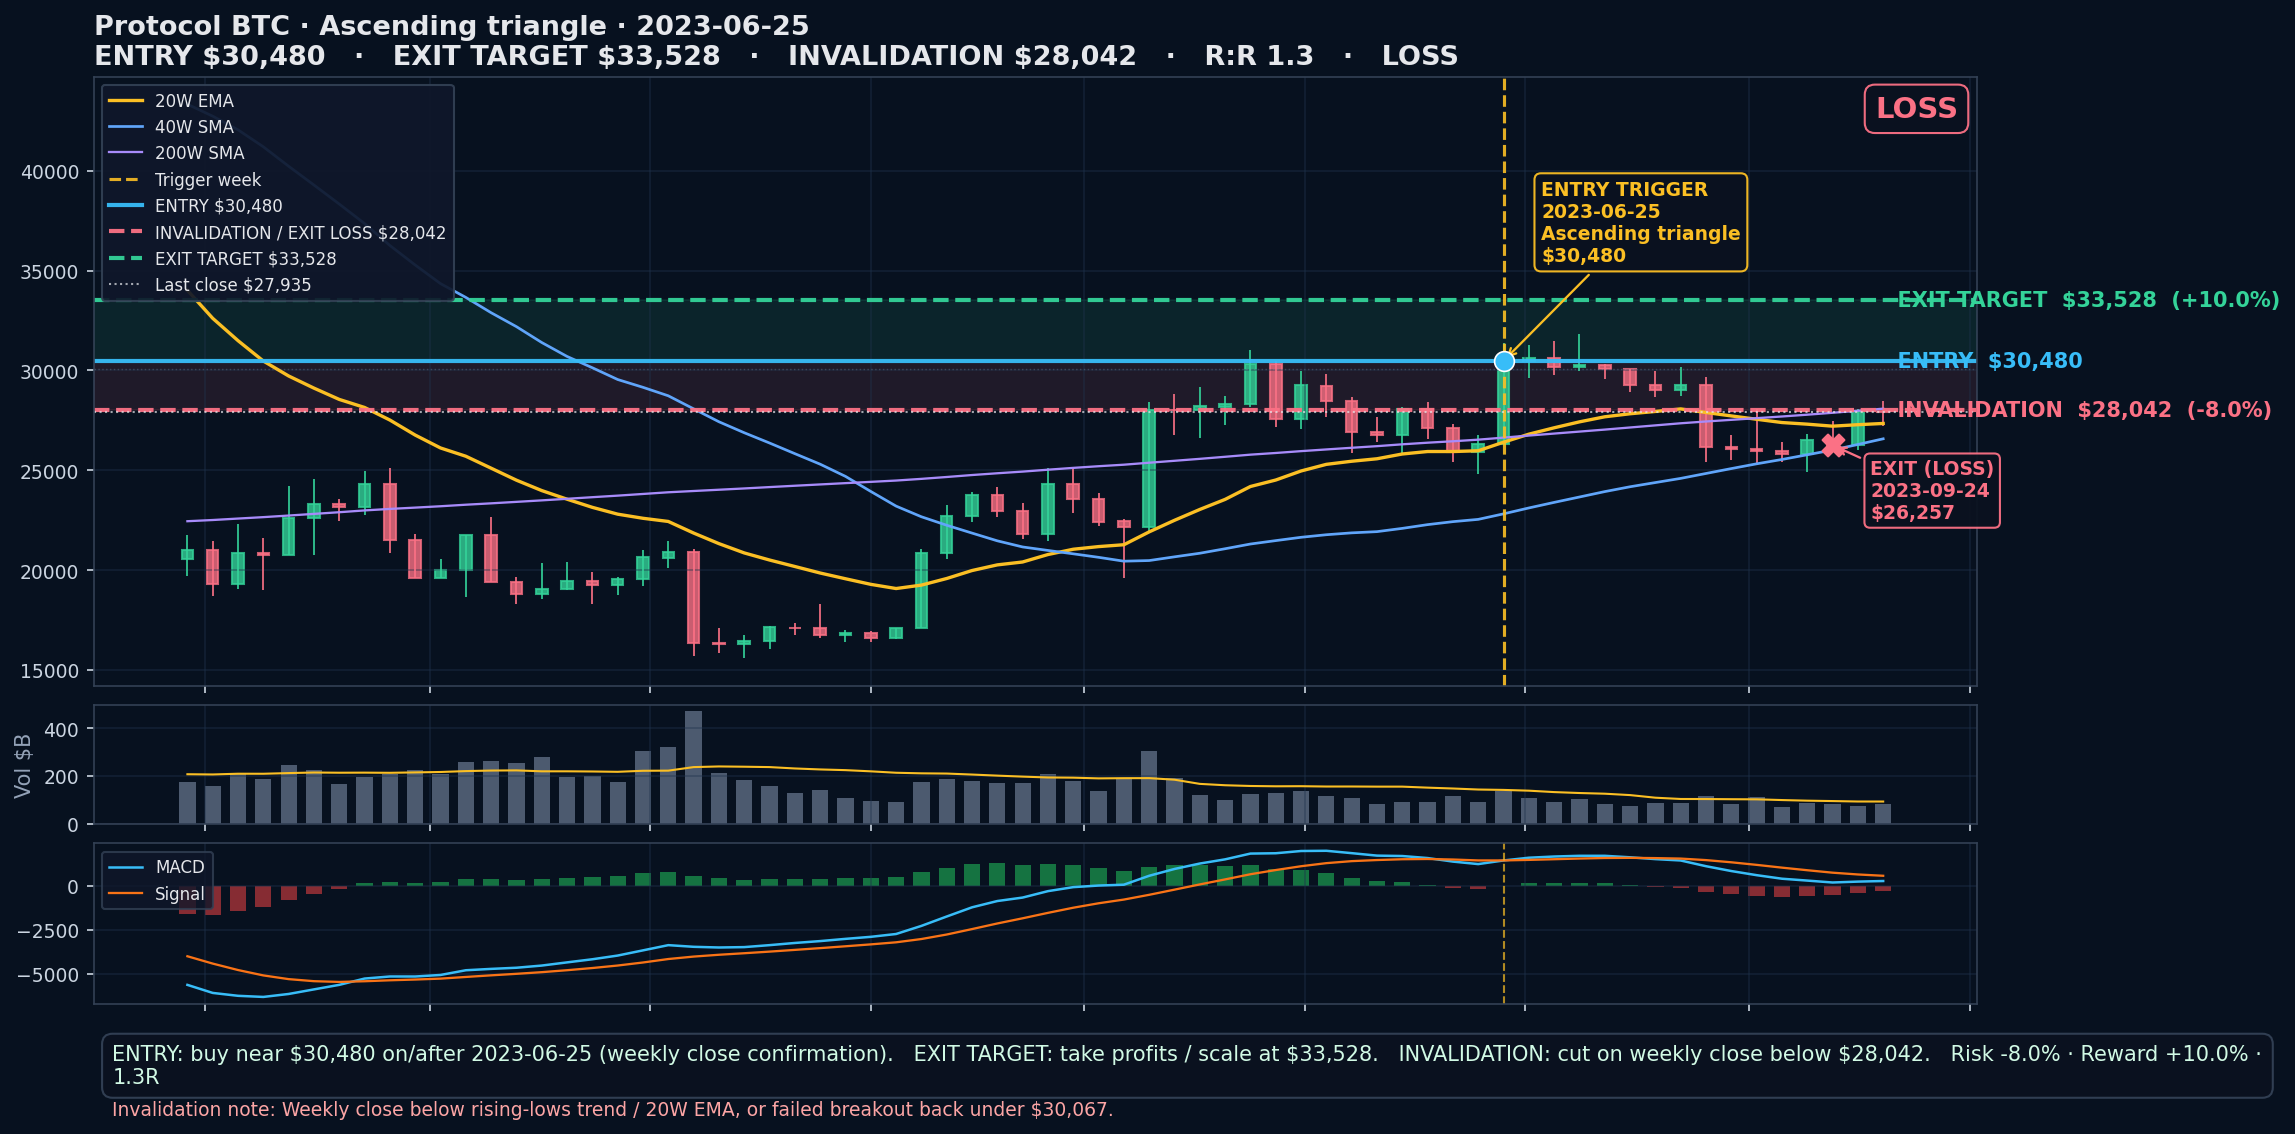
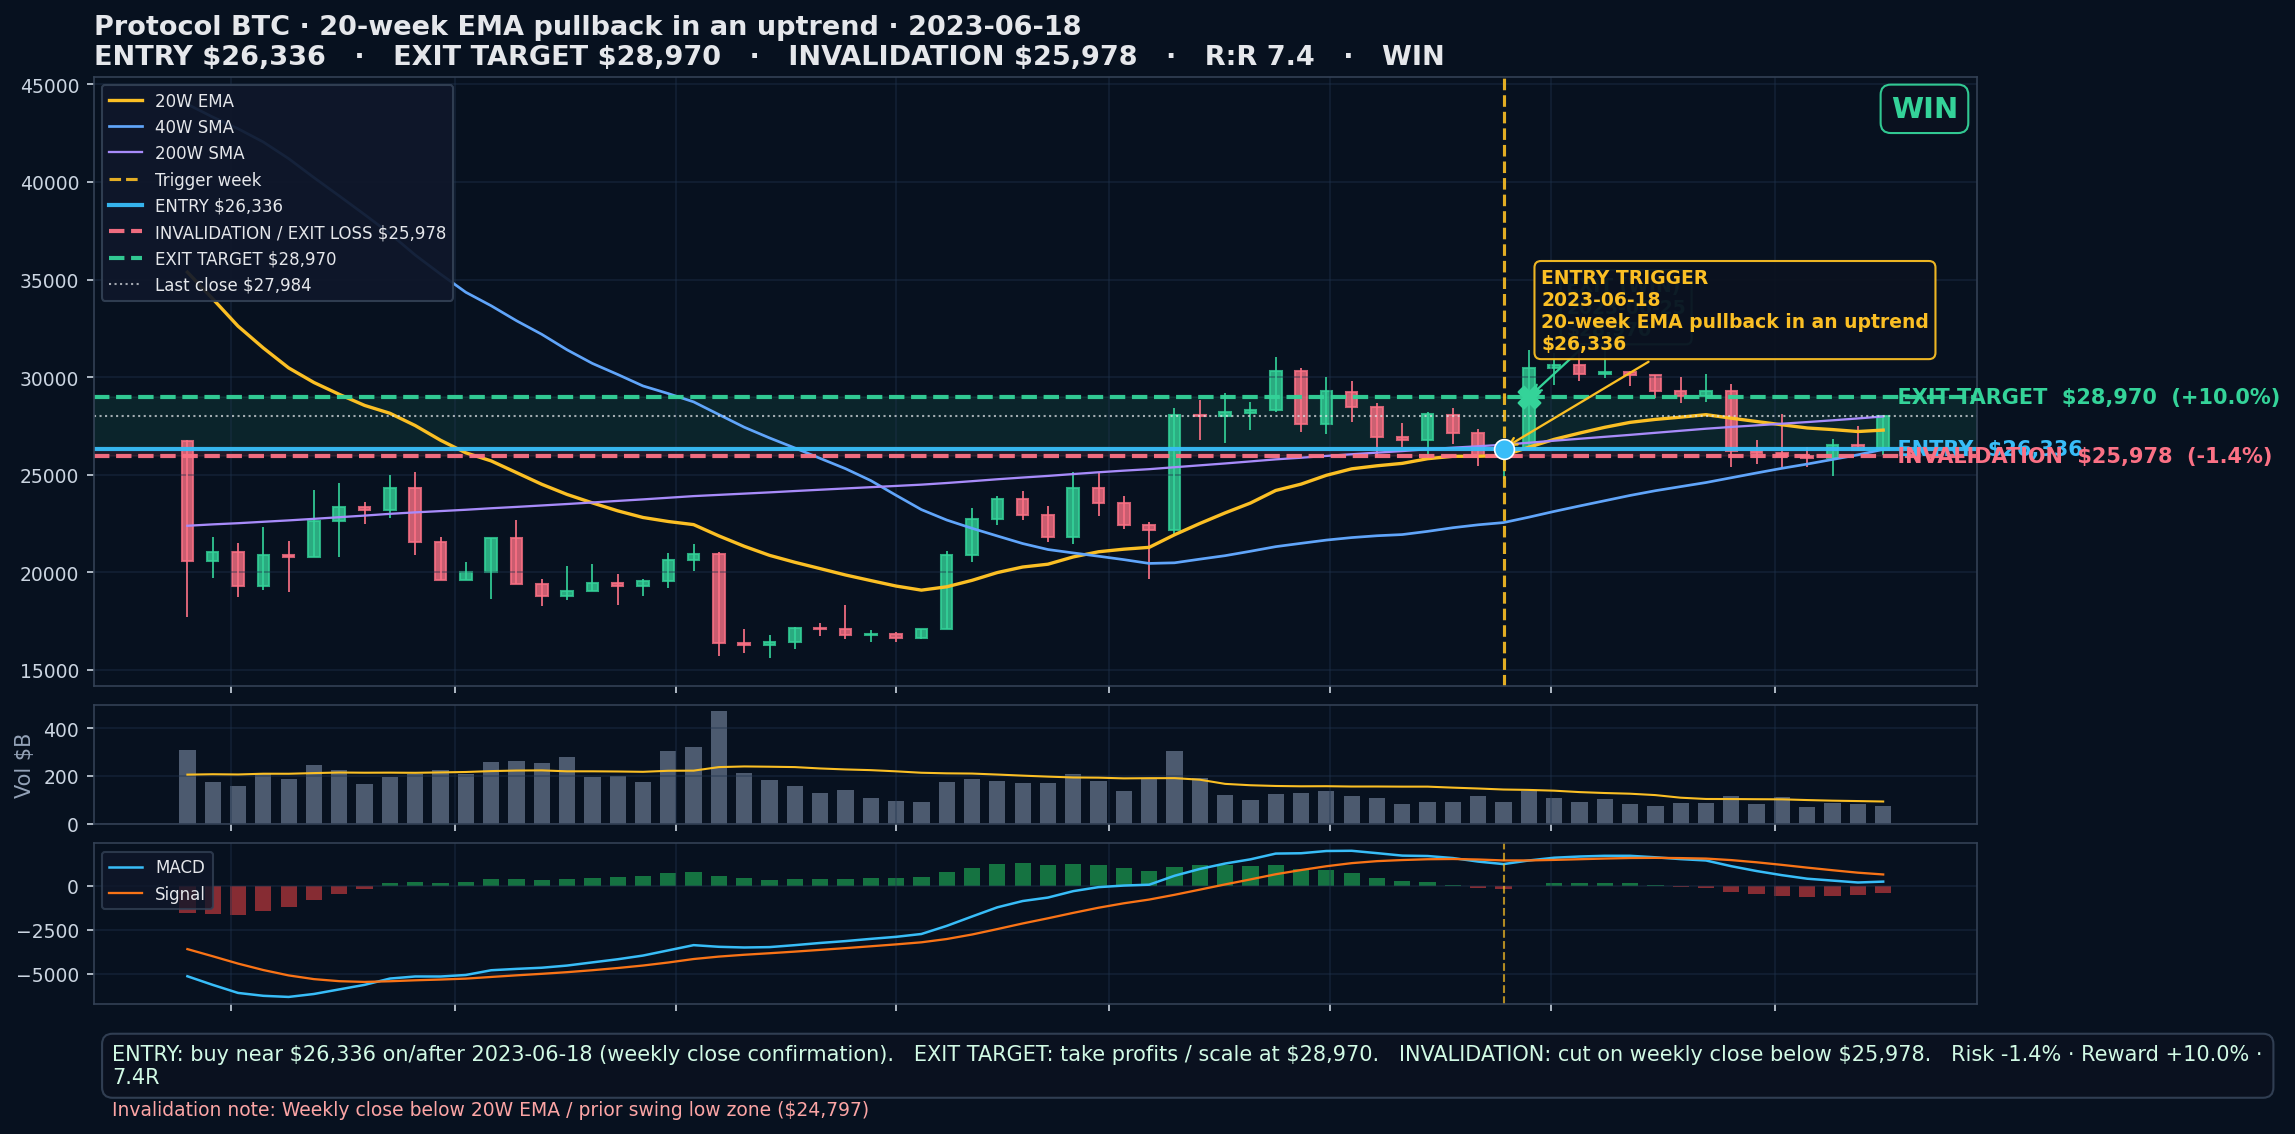
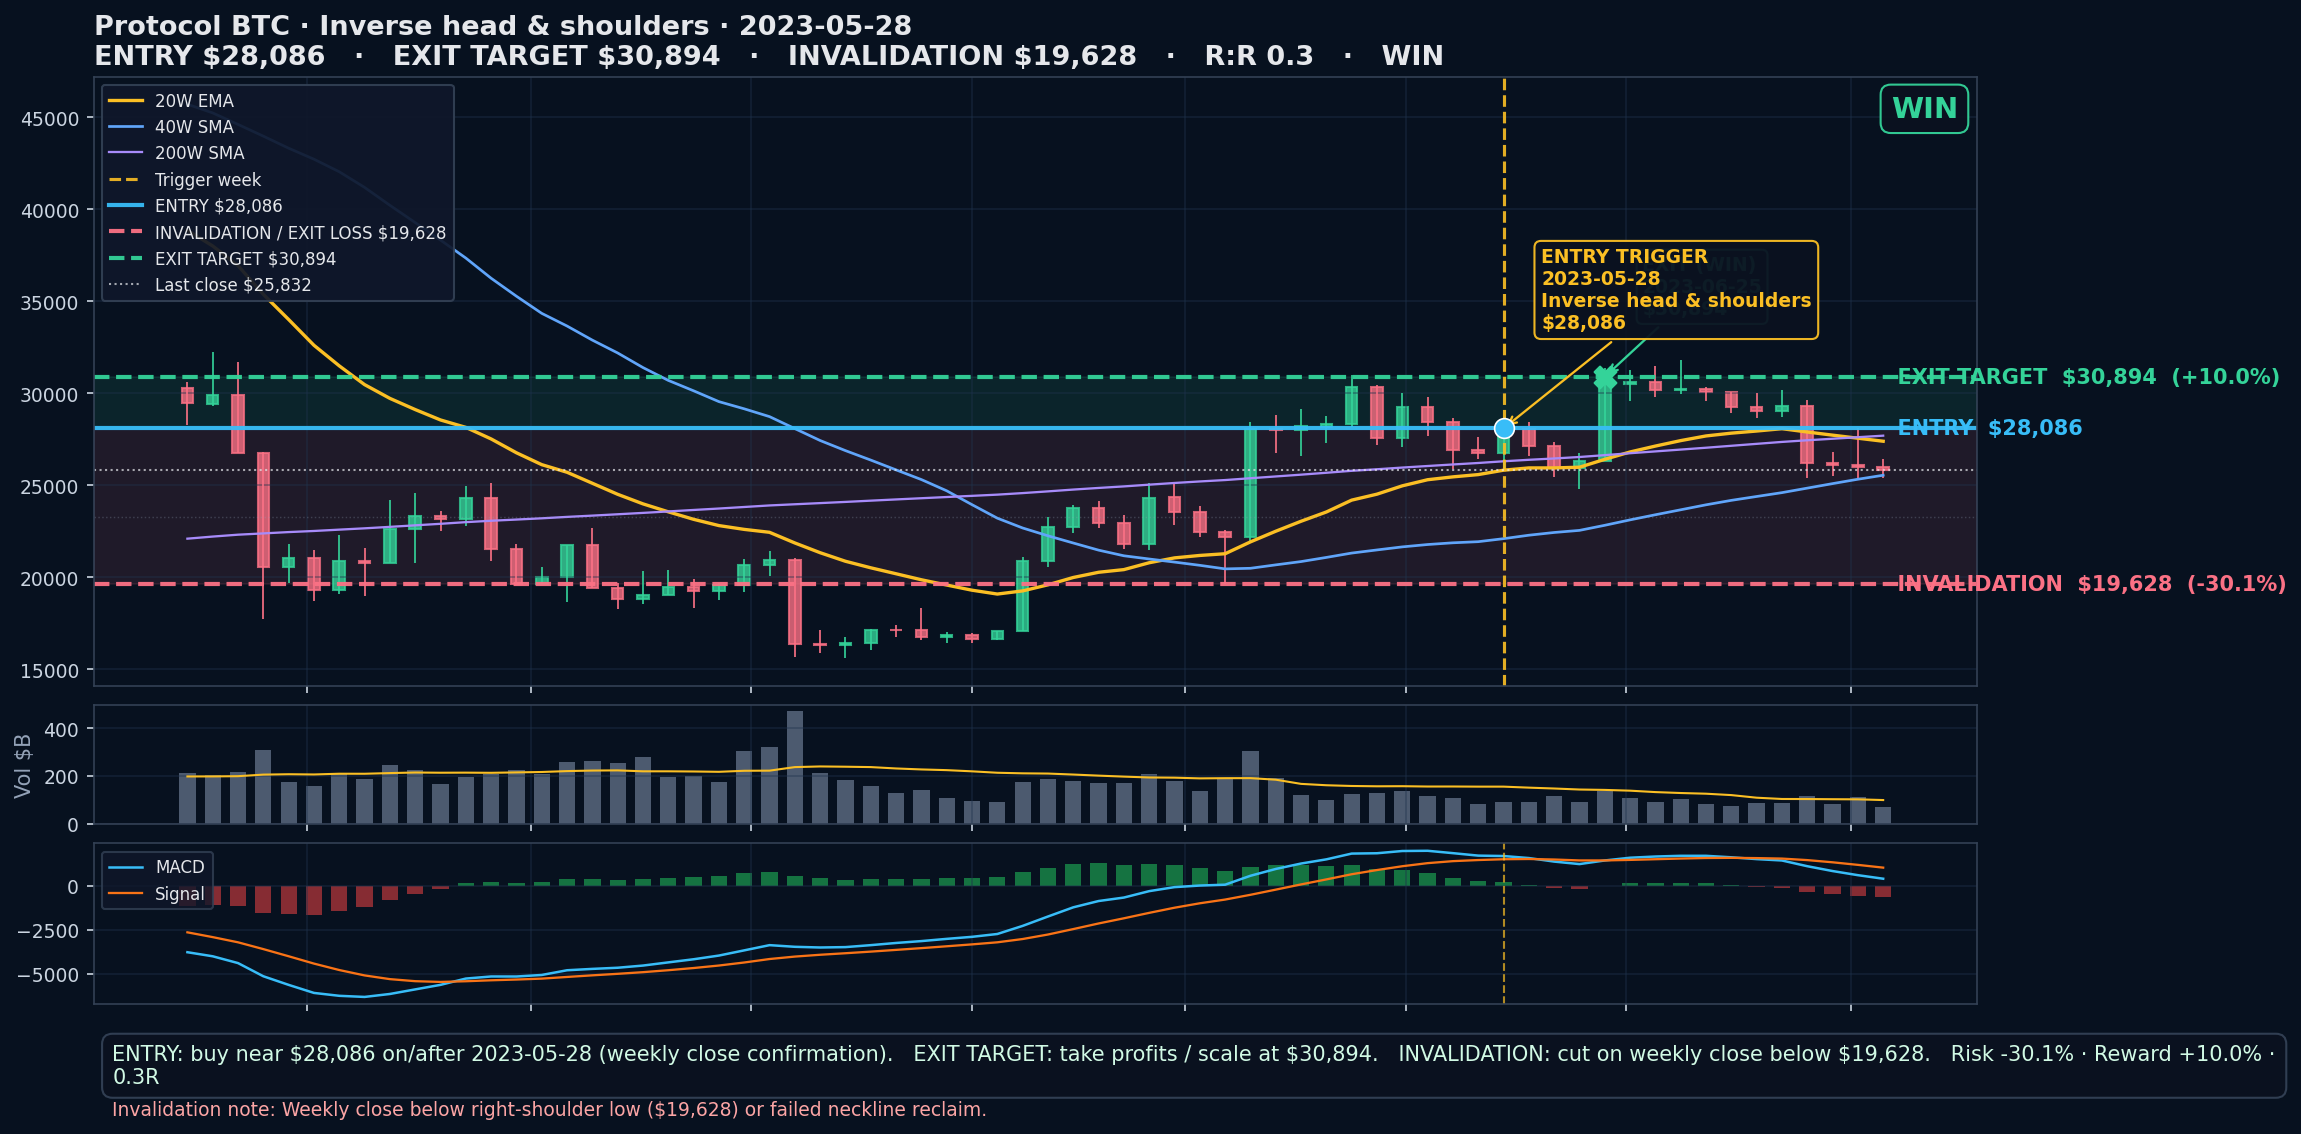
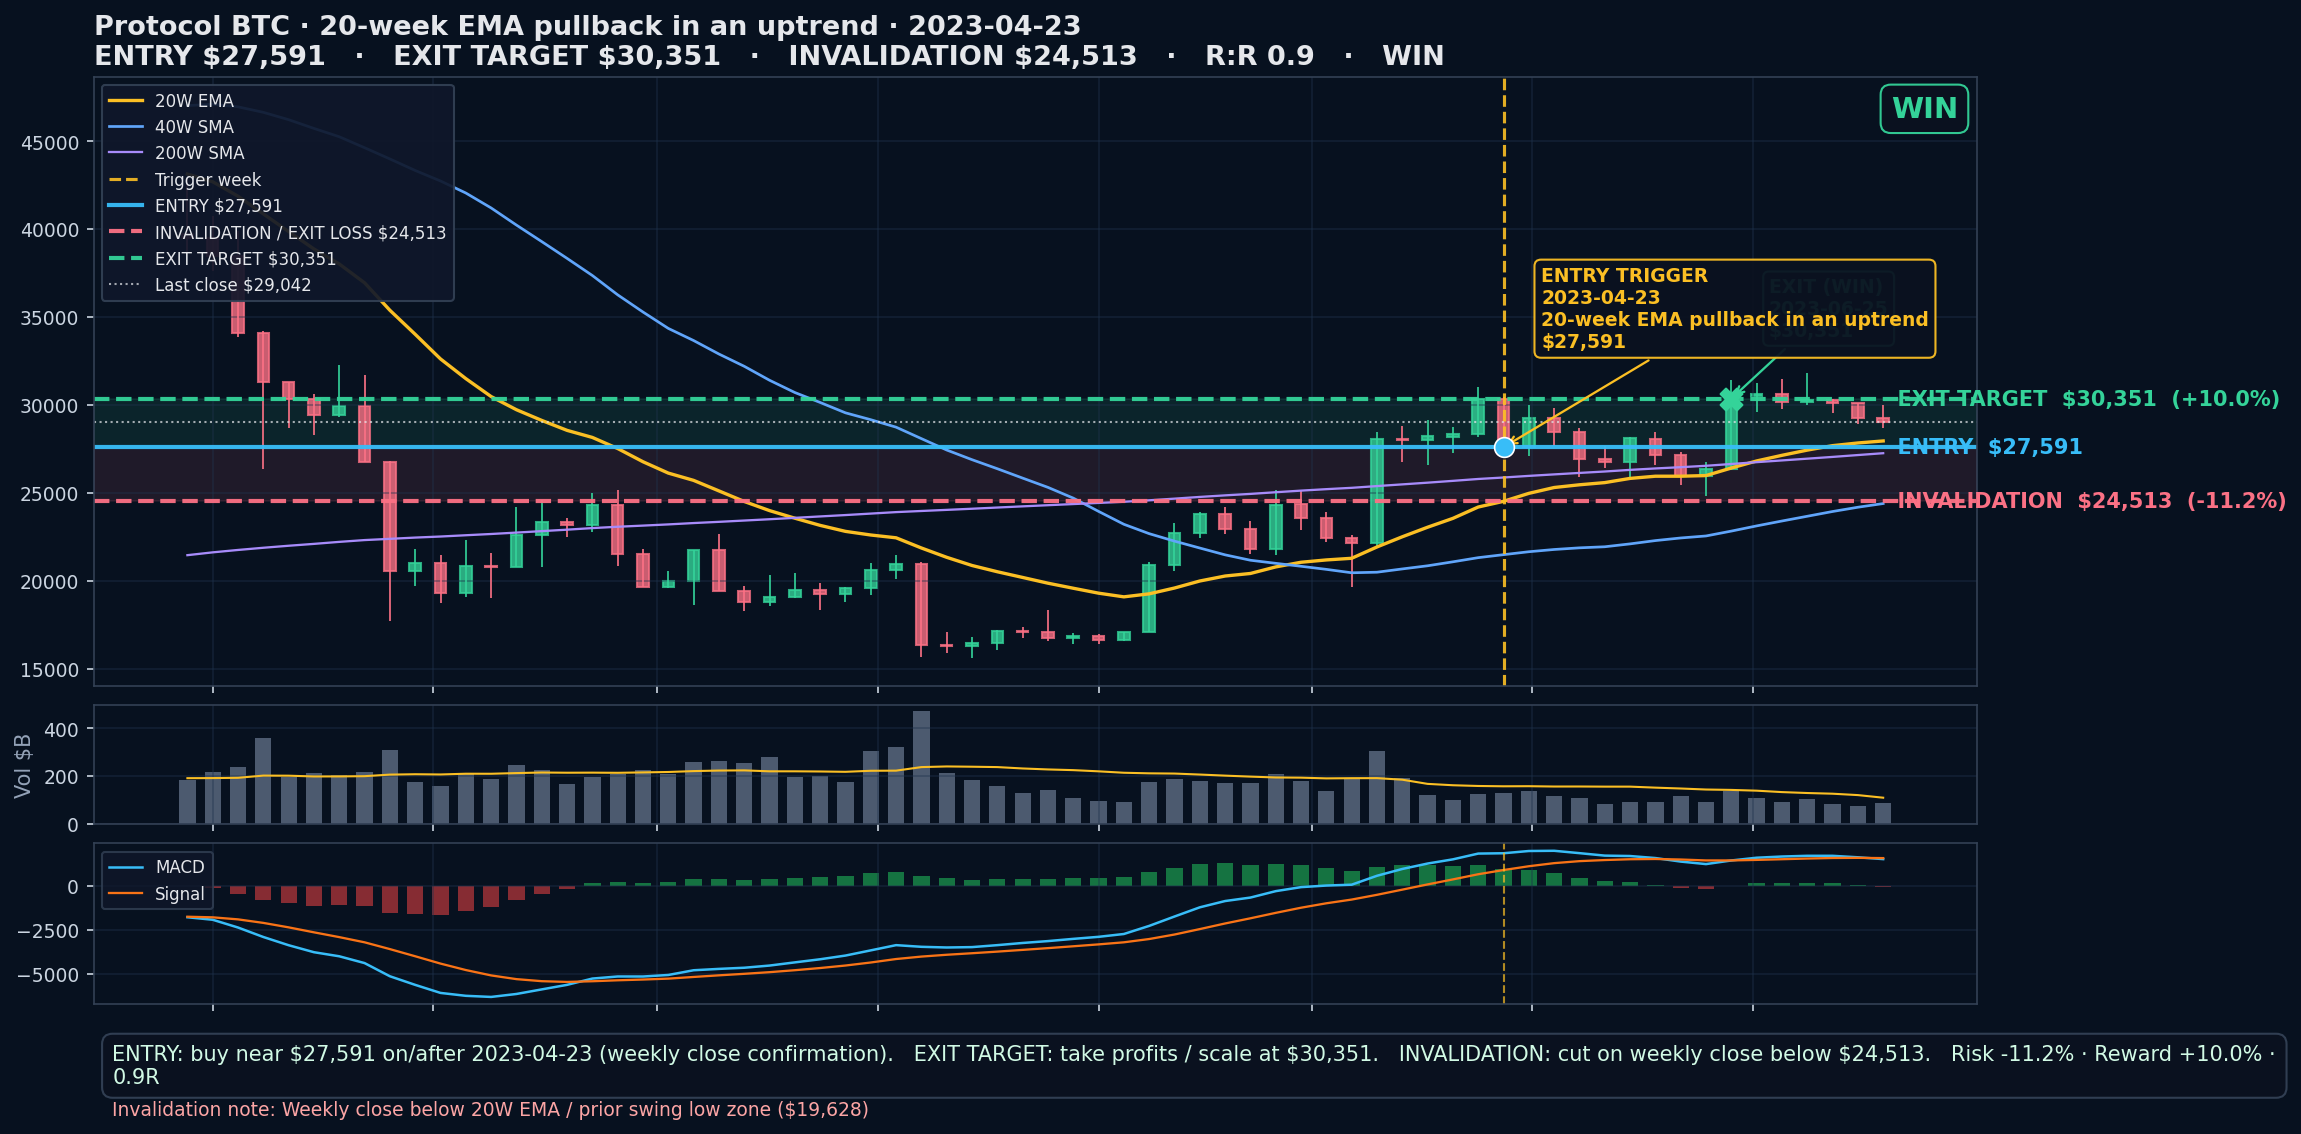
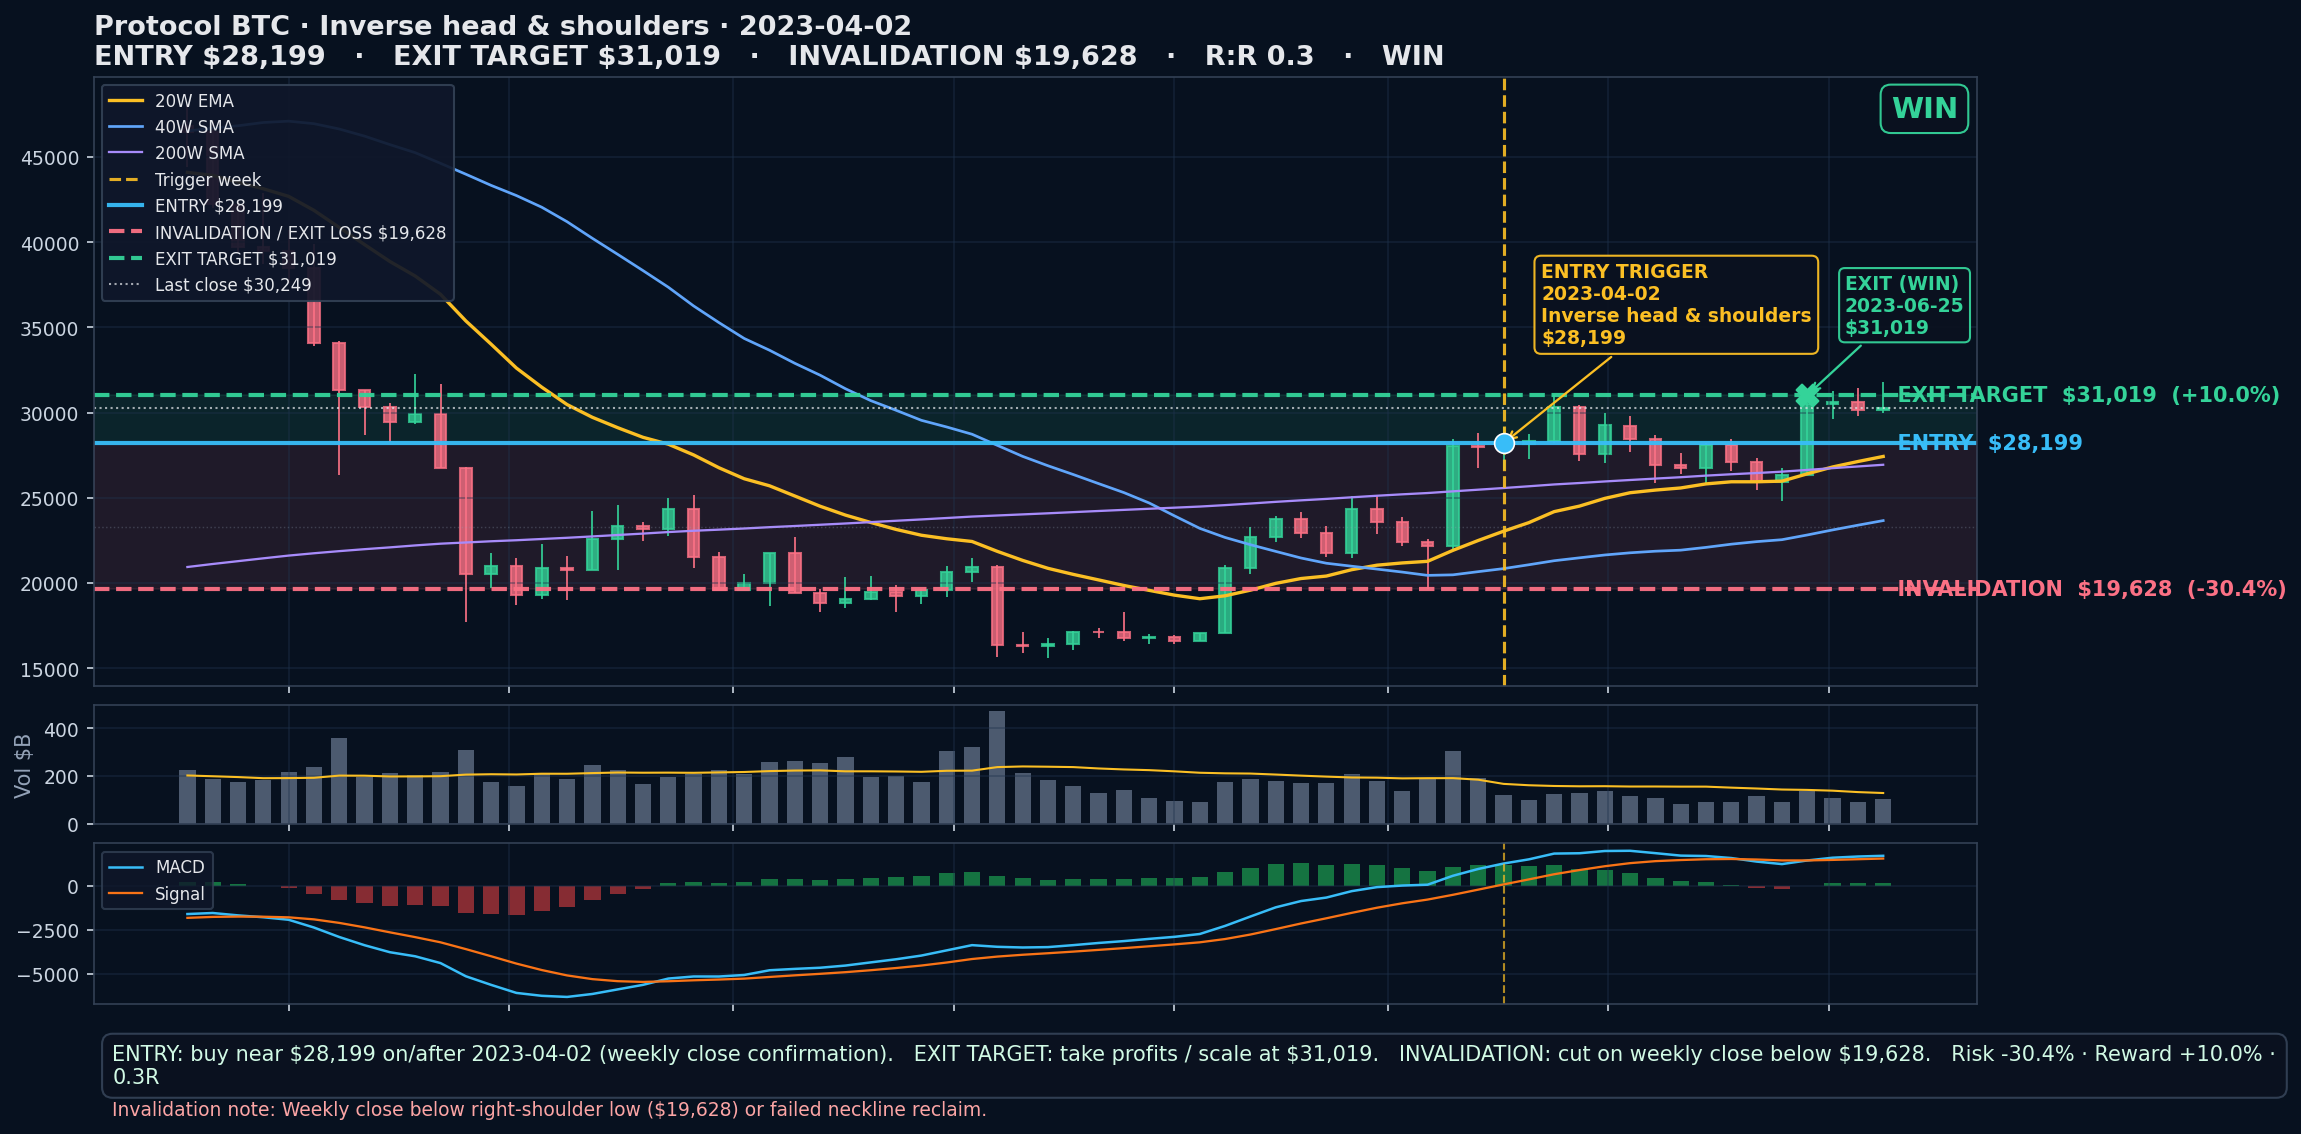
Thesis: Weekly MACD line is -5400 vs signal -5591; histogram 191.
Trade plan used: Buy a small staged long in BTC or IBIT (spot first; no leverage unless portfolio regime is already risk-on).
Entry instructions: ENTRY: buy near $65,340 on/after 2026-07-26 using a weekly close confirmation for the pattern. Do not market-chase far above entry without a plan; if price is already >3–4% through entry, wait for a hold/retest.
Exit instructions: EXIT WIN: scale out into $71,874 (first tranche at target; trail remainder above rising 20W EMA if trend continues). EXIT LOSS: flatten or cut adds on a weekly close under invalidation $60,113. TIME EXIT: if neither target nor stop by ~13 weeks, reassess — reduce if structure weakens.
When to put it on: On/after the weekly close that printed the MACD bullish cross (2026-07-26). Best if price is reclaiming or holding above the 20-week EMA; if still below a falling 20W EMA, wait for a weekly close back above it before sizing up.
When to add: Add only on a green weekly close that keeps MACD above signal, or on a shallow retest that holds the 20W EMA.
Size: Size: starter 25–40% of intended BTC sleeve add; leave room to add once. Prefer spot/IBIT. Options/leverage only if portfolio regime already allows heavier risk/calls.
Risk math: entry $65,340 · invalidation $60,113 (-8.0%) · first target/exit $71,874 (+10.0%) · reward/risk 1.3R.
Invalidation text: MACD line rolls back below signal on weekly close or histogram flips materially negative.
Action: HISTORICAL PLAN (not a live order): on 2026-07-26 the play was buy near $65,340, invalidation $60,113, target/exit $71,874. Outcome: WIN.
Resolved outcome: WIN on 2026-08-23 @ $71,874 (+10.0%) — target hit